A question we get asked all the time: Will Clarity slow down my site and affect website performance?
Since we are talking about speed the quickest answer is No.
Continue reading “Does Clarity affect website performance?”A question we get asked all the time: Will Clarity slow down my site and affect website performance?
Since we are talking about speed the quickest answer is No.
Continue reading “Does Clarity affect website performance?”Cookies are a vital feature for the functionality of many websites. This post will help answer some common questions about cookies and how they are used in Clarity.
Cookies, also known as HTTP cookies, web cookies, or browser cookies are small blocks/packets of data created by a web server. A cookie consists of information in key-value pairs, which can be used to identify your page, session, computer network, users, and so on. Cookies, therefore, improve your personalized browsing experience. For example, when you select a language on a website for the first time, a cookie can save your preference for later use so that you don’t need to be prompted every time.
Cookies are very common. The average user’s browser has hundreds of cookies stored across websites visited.
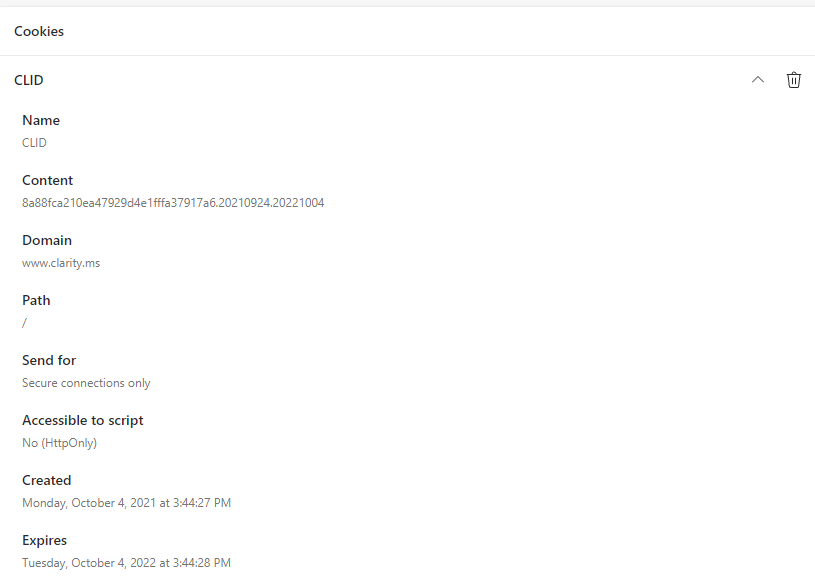
A cookie is a small block of data. Your web browser stores and handles cookies. Each web browser has its own set of cookies, and you can manage it from the settings window. In Microsoft Edge, you can find web cookies in ‘Settings’ ->’ Cookies and site permissions’ -> ‘See all cookies and site data’.
Cookies enhance users’ web experience by making it faster, convenient, and personalized. Below are a couple of reasons why websites use cookies:
For Clarity to function fully it requires that we set cookies on your visitor’s browser. Once you’ve installed the Clarity tracking code on your website, Clarity will start writing cookies when customers visit your website. Clarity’s cookies send us non-personally identifiable information such as session data. Check here to learn what cookies does Clarity set.
European Union (EU) requires websites to adhere to the cookie law. The basic rule around cookies is that websites must:
And yes, your data is secure, and Clarity is GDPR-compliant. Visit Clarity’s Terms of Use to learn more. For more answers related to Data Privacy, refer to the Privacy FAQ.
Setting up Clarity cookie consent is one toggle away!
Clarity’s normal functioning requires that we set cookies on your visitor’s browser. By default, Clarity’s tracking code is placed in the HTML header of your site. The cookies are written instantly before your user indicate their consent. Change the setting referenced in the documentation, not to set cookies immediately, and set a flag to tell us when it’s okay to set cookies.
When the script is installed, Clarity’s cookies send us non-personally identifiable information about your users.
Learn more about Clarity data collection.
Read more about Clarity on our Blog page.
Though the Google Analytics (GA) dashboard and Clarity dashboard is set to the same timeframe, you might have noticed different numbers in each dashboard. This post will help you understand why there are discrepancies in the numbers.
Continue reading “Why do I see different numbers in Google Analytics & Clarity?”Wow! What an amazing week celebrating Clarity and our big milestone – our 1st Birthday!
Since its launch, our mission has been to make behavioral analytics more accessible and actionable. A year on, it’s still our driving motivation.
As Clarity’s birthday celebrations come to a close, we want to take this opportunity to thank Clarity users all over the world. Without you, Clarity would not be the product it is today.
For our final celebration post, we have a few more messages to share.
Our global team works tirelessly to make Clarity a product our users find helpful and useful. Click the video below to meet some of our team (and get a sneak peek into how we’ve worked during the pandemic).

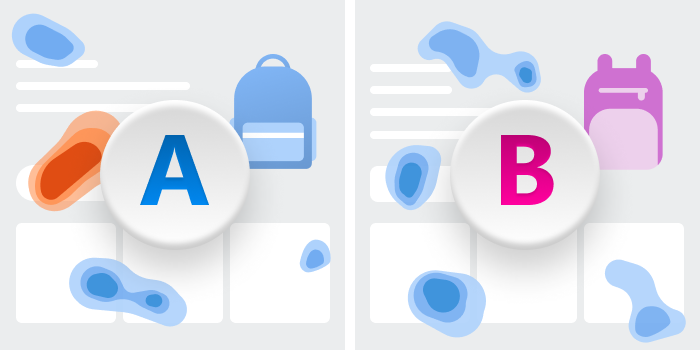
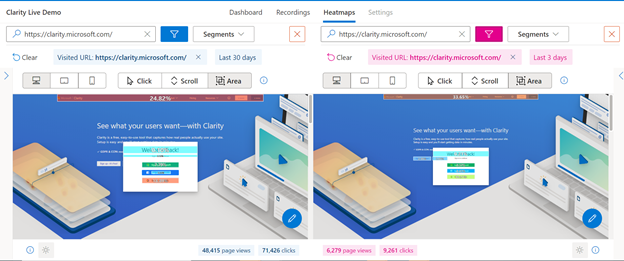
Side-by-side view of two heatmaps, to understand historic and current user behavior.
Aggregated heatmap to see how users engage with elements and larger parts of your page.
We’ve also started focusing on targeted insights based on your site category. Our new e-commerce and blog features will game-change how you understand your visitors.
See the distribution of reader types and reading behavior on your site -are readers finishing the article or abandoning at headline?

Slice and dice sessions by product name, their price, their brand, average ratings, and more
Watch successful sessions and isolate the key Checkout steps prone to buyer abandonment
We’d be remiss if we didn’t also include some feature highlights from this past year that we think you’ll love.


And of course, we love hearing from you. See below some of the tweets that have excited our team over the last months:
❤️ https://twitter.com/jasoncartwright/status/1449016749849030659
😍 https://twitter.com/KristenSousa/status/1433808493249798146
👍 https://twitter.com/CyrusShepard/status/1356408320765042689
😎 https://twitter.com/RyanJones/status/1423344433844658176
😊 https://twitter.com/WebMngr/status/1443674239664594946
💖 https://twitter.com/navahf/status/1423335010933907462
This past year has been an exciting ride for us at Clarity…and we’re only getting started.
We have some cool features in the works and would love for you to join us on the ride! Tell us what you like and what you want more of:
Our team is looking forward to Year 2 and hope you are too!
Labels is a new organization feature for Clarity. You can label sessions recordings with custom text to organize your findings and then come back to them later by filtering. Labels are shared across a project, meaning you can collaborate with your team members to find even more important recordings.
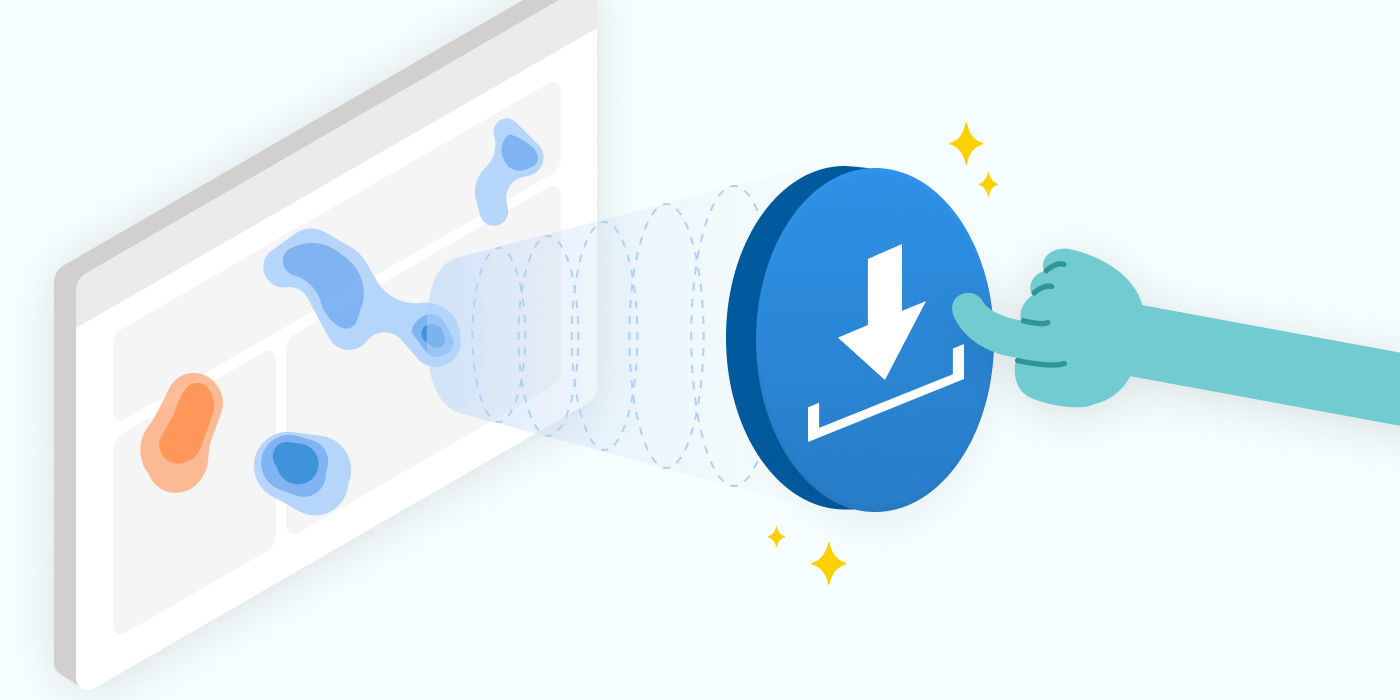
Continue reading “Label what matters with Clarity”For our fourth release of the week, we bring you exporting. The ability to export your recordings data to excel and download your Heatmaps and Dashboard for viewing offline.
Continue reading “Clarity now supports exporting”Have you ever wondered if users find your content interesting? Do you want to know which articles make readers browse more on your site? In addition, what’s the overall site experience for a user who abandons right after reading just the headline?
Continue reading “Clarity launches Content Insights for blogs!”As we mark our 1st birthday, we wanted to take a moment to share how far we have come, what we have learned, and what we have in-store…
Continue reading “A year of Clarity”Heatmaps have always been our most popular feature! Our customers love how quickly they can see user behavior without having to dig deep into the numbers. However, a big customer ask has been the ability to compare two heatmaps side by side. Well, our awesome team has been hard at work to deliver this update and today we bring you Compare mode!
Continue reading “See two heatmaps side-by-side with Compare mode”During our birthday celebrations, we thought it only right to give our customers a feature they really wanted! Introducing – Area maps!
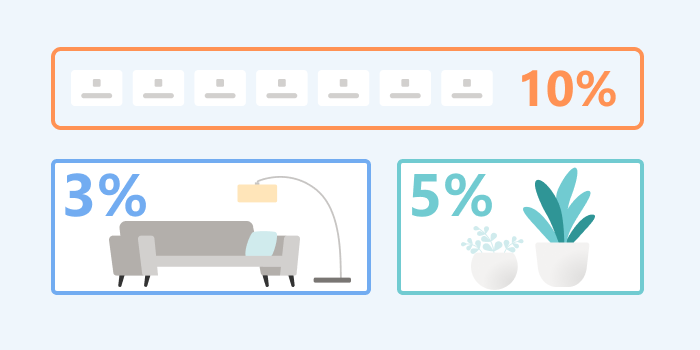
Area map is a new type of heatmap that shows you the total clicks for all the elements within a selected area you choose.
We show this in 2 ways:
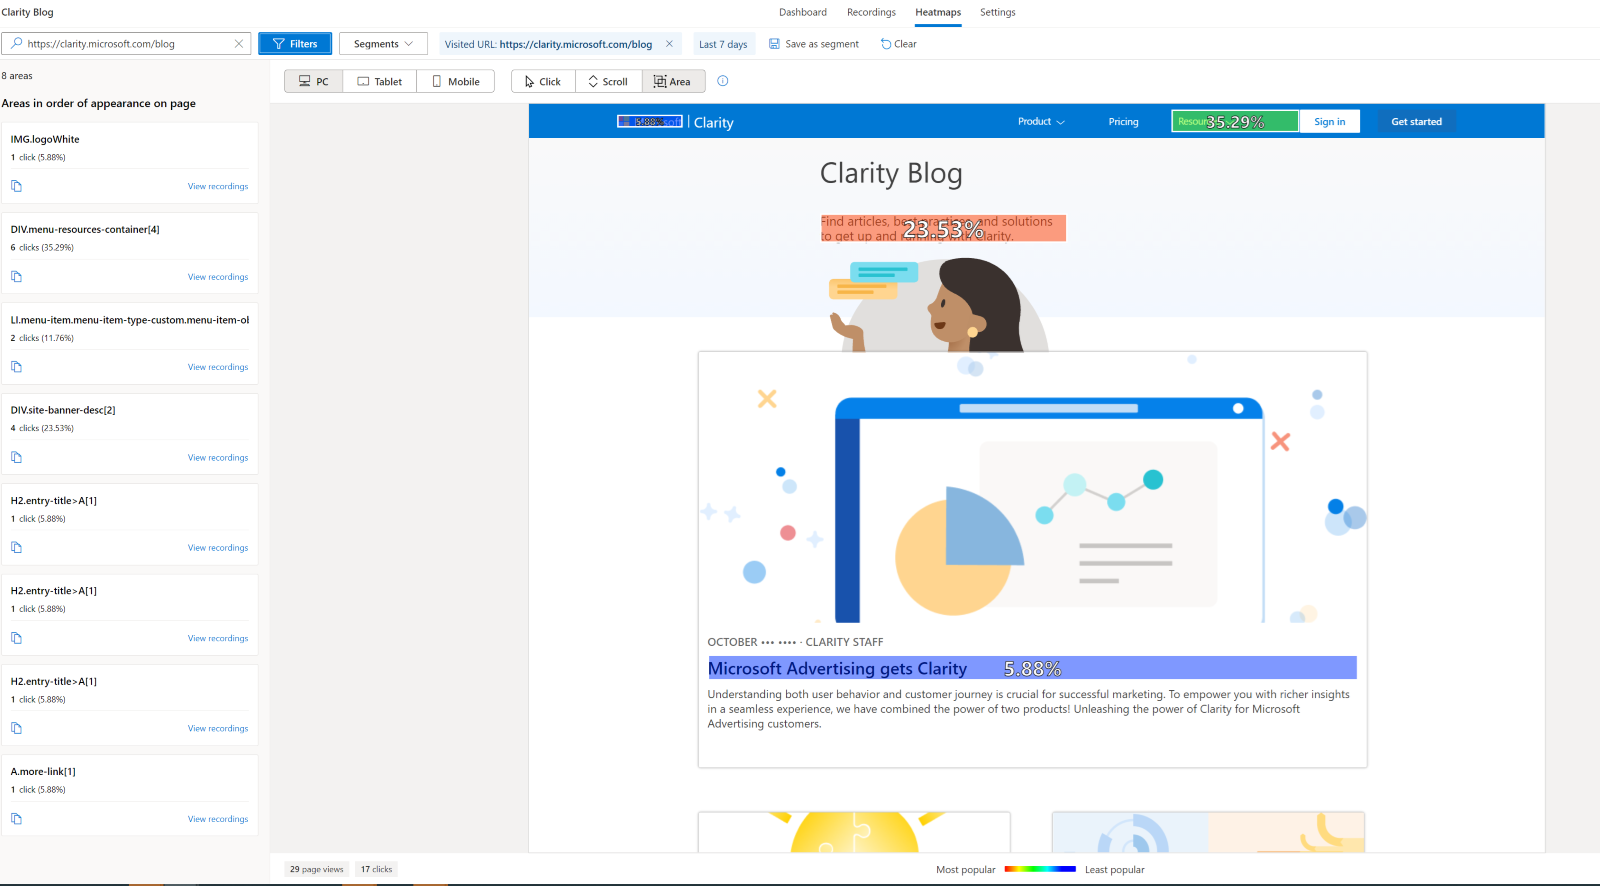
This makes it very easy to see if the right elements on your page are getting the desired attention.
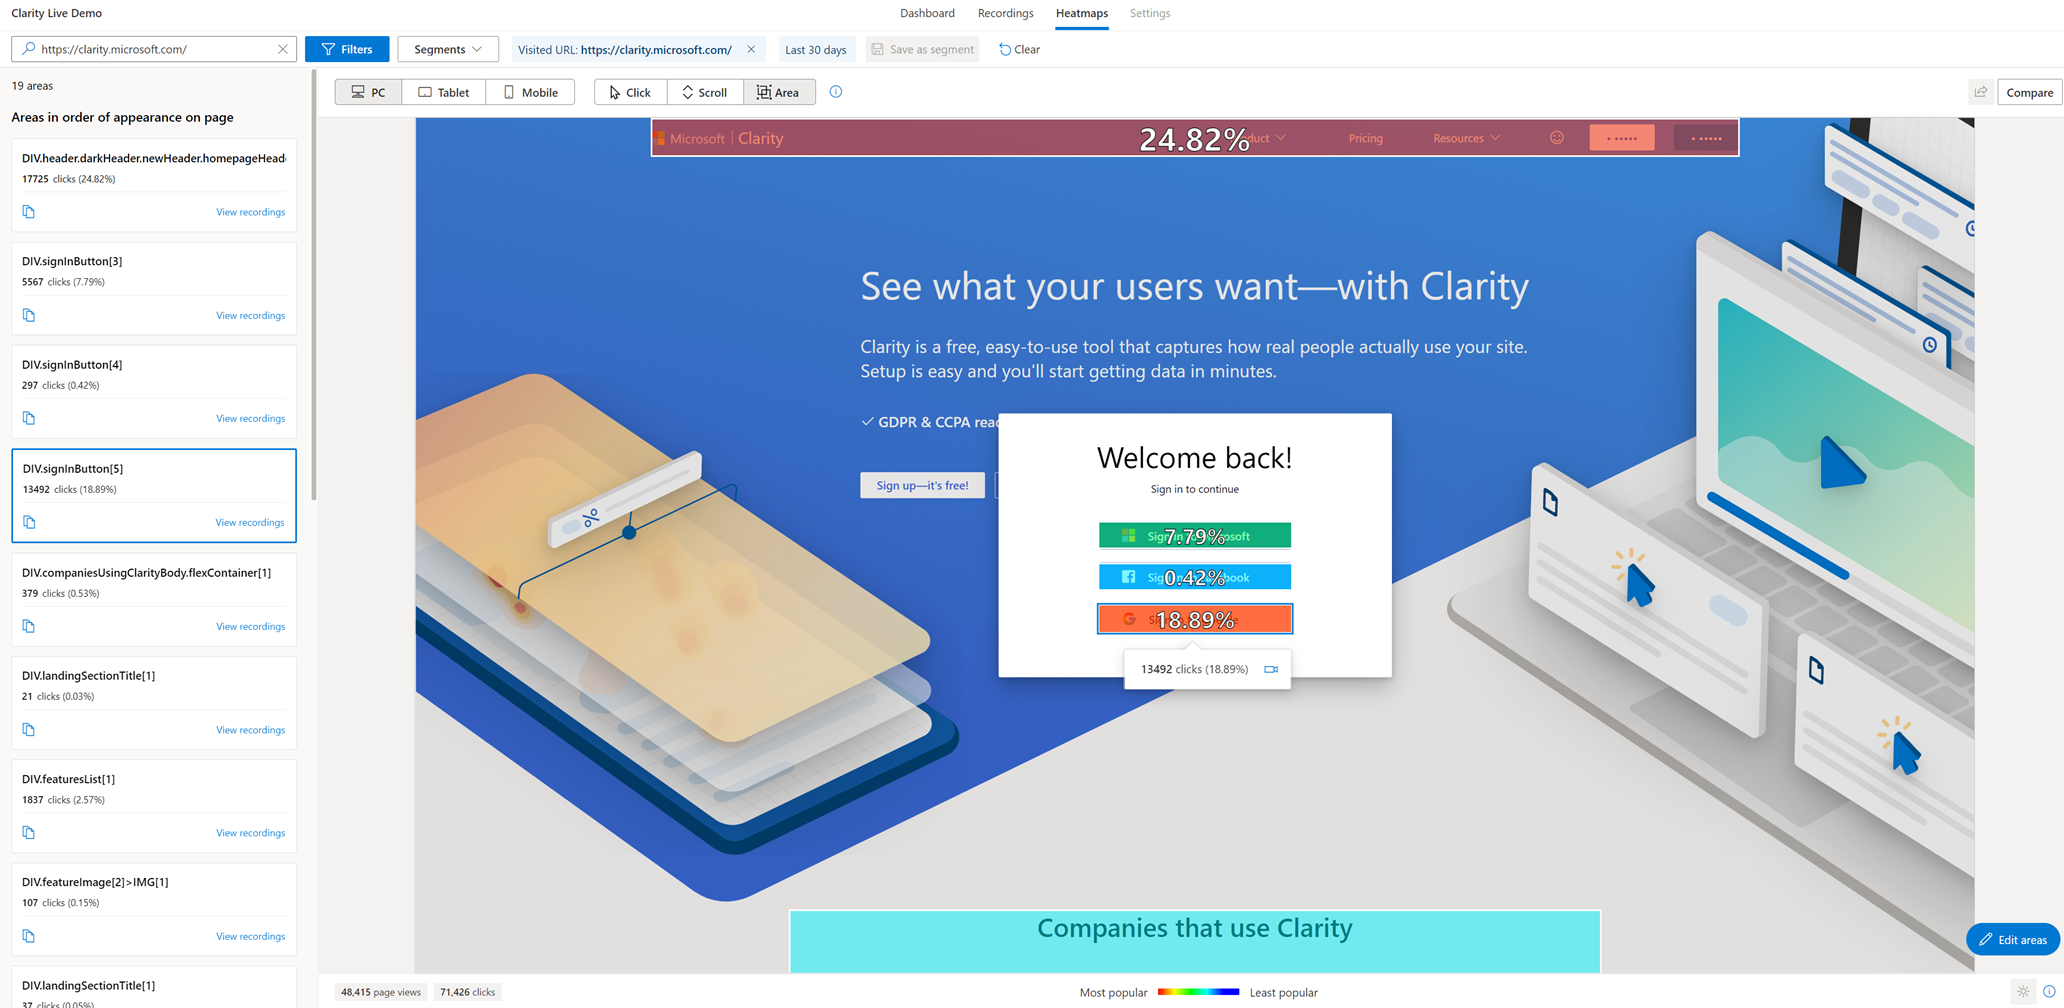
A Click map shows you where users clicked on the page using coordinates on the x-axis and y-axis. Whereas an Area map shows the total clicks for all the elements within an area you choose. We wanted to make it easier for our customers to choose areas they care about and aggregate the clicks for all elements within it.
The image below shows our homepage.
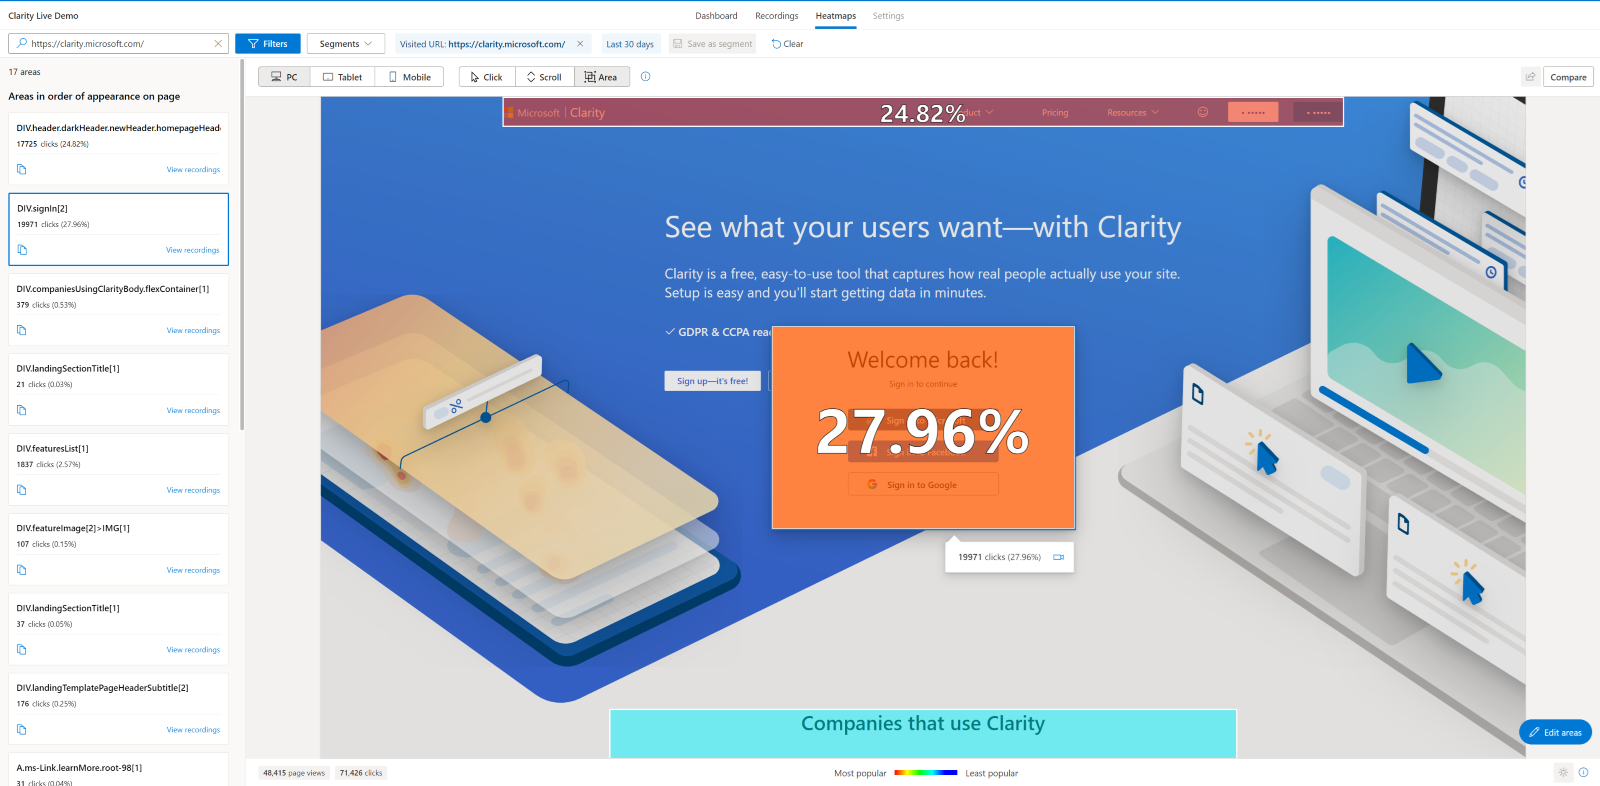
We can easily see that across the last 30 days nearly 28% of visitors have gone to complete the sign-in process. That’s excellent information for sure!
But what if we wanted to dig deeper and see which sign-in method has been the most popular?
Easy, we can select edit area and drill down to each sign-in element.
We can now see which of the given sign-in options is the most popular!
Digging even further, in the future we could AB test different orders using our upcoming new feature, heatmap compare to see if changing the order has any impact on customer behavior.
So there you go! Area maps are here! We are pretty sure this will become a firm favorite with customers.