Lights, camera, and action! Clarity now supports live sessions with zero delay. Starting this week, Clarity has added this functionality to Session recordings: Live recordings tab. You don’t need to do anything special to get this feature, just open your Clarity account and start accessing your real-time videos.
How to Watch Live Recordings
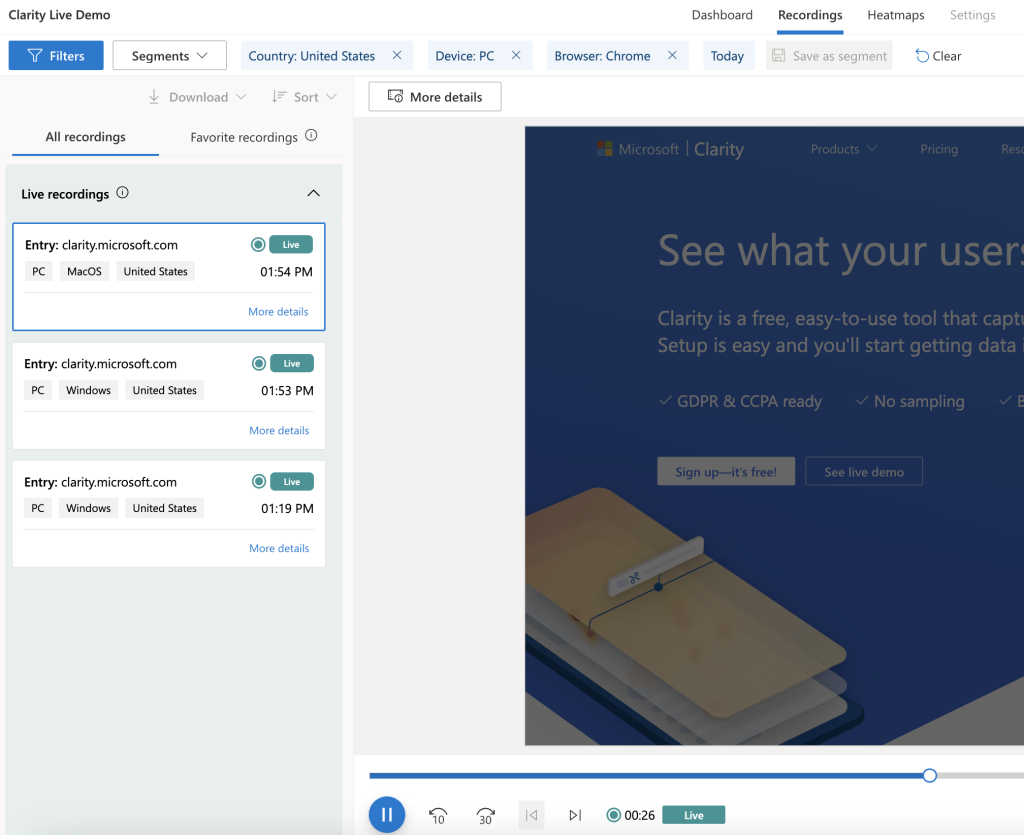
You’ll see Live Users and Distinct Users in your Clarity dashboard or session recordings. Select the Live Users recordings to view the users currently on your website. Live recording is perfect for checking if you installed Clarity correctly, monitoring bugs on a new feature launch, and getting a front-row seat to your customer’s experience.
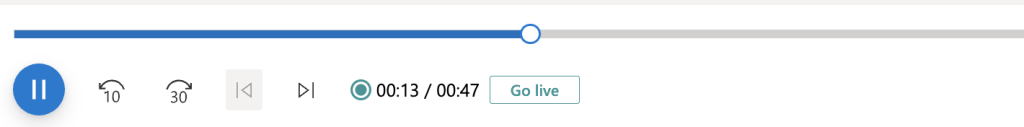
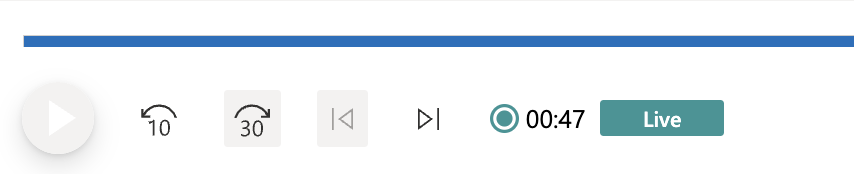
You’ll be able to watch those users in real-time without delay or watch the session from the start up until they haven’t had any recent activity. There will be three different view settings that will indicate the viewing status.
Not Live
If you’re watching something that happened in the past, the button will say GO LIVE, letting you jump to where the user is right now on your website.
Live
If the button says LIVE, you are currently watching the most updated actions your user is making. If you want to watch from the start, click the beginning of the timeline.
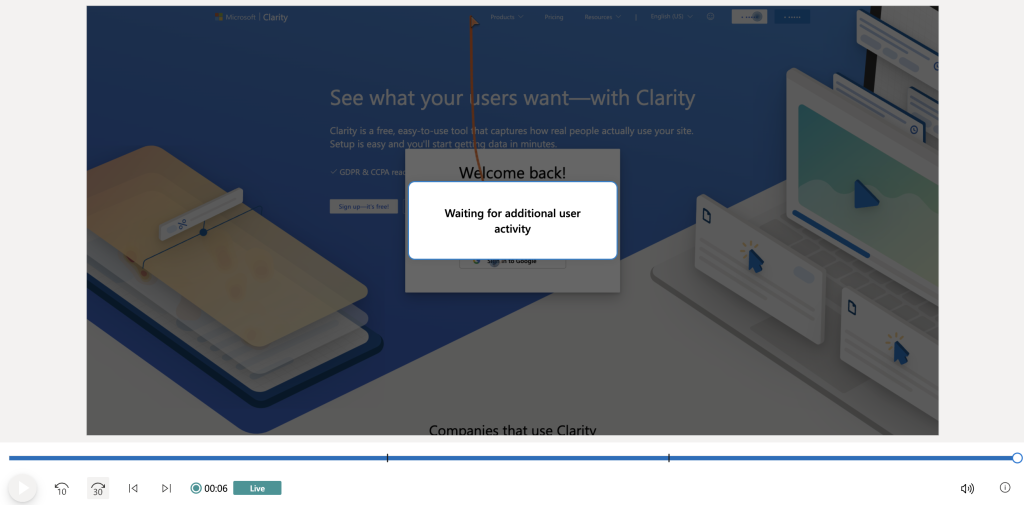
Waiting for Activity
This notification will appear if the user has paused their activity. It will resume as soon as the user begins to engage with your website.
Why Doesn’t My Recording Have a Live Option
If you’re looking at your session recording and don’t see the LIVE option, this means you’re viewing a recording from a past session. These are useful when filtering data to look at dead clicks, javascript errors, and any other query you desire.
Filtering in Live View
Since we are on the topic of filtering, there are a few options to filter through when using the live view. The main filters are device, browser, operating system, and country. This can help you narrow down the live recordings you would like to watch.
Tell Us How You Use Live Recording
Clarity Live Recording is a feature we are super excited about at Clarity. We will continue launching new features that will provide value to our users at a low fee of FREE forever 😀!
Give it a try, and if Live recording becomes a part of your team’s process, email us your story at claritycasestudies@microsoft.com. We’d love to discuss featuring you in an upcoming customer case study!
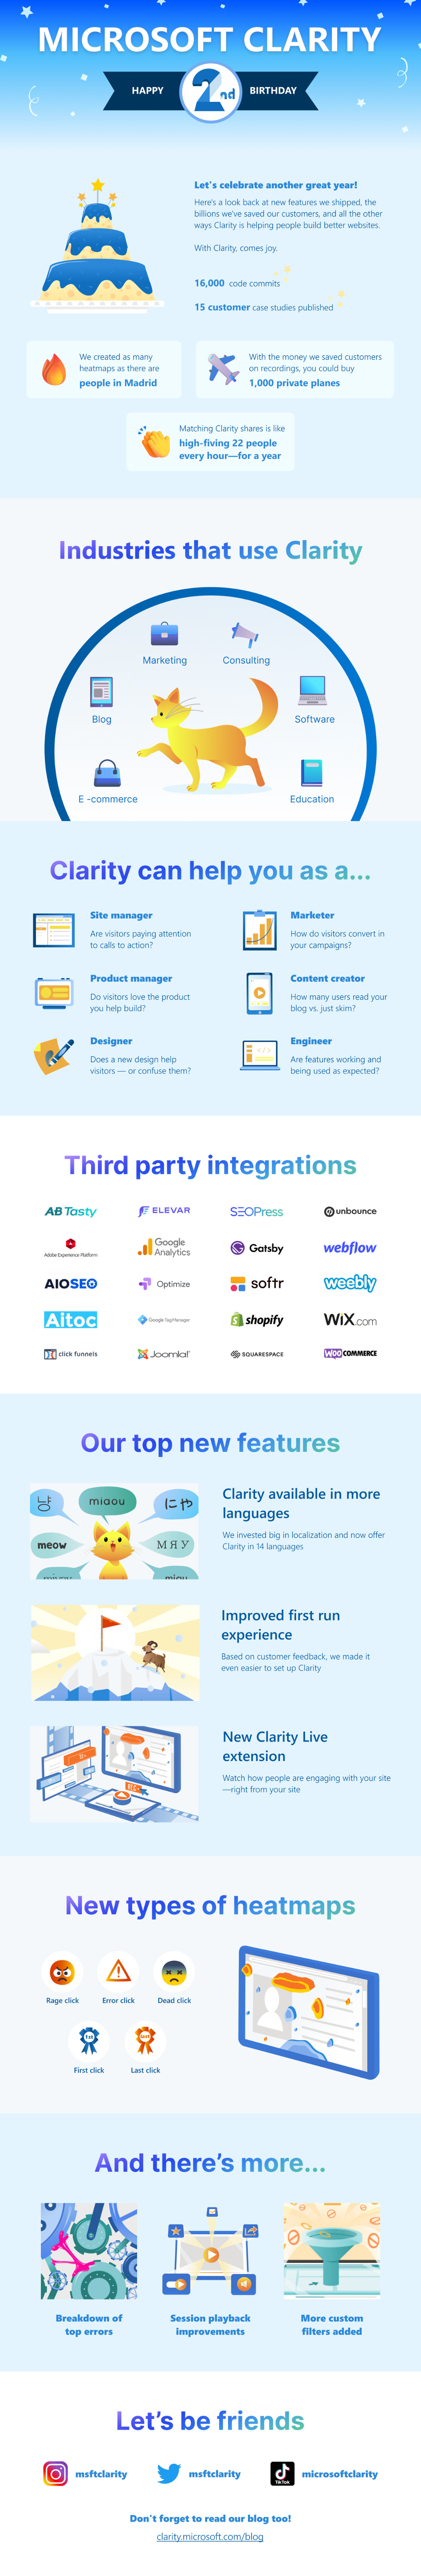
Happy 2nd Birthday to us! We’ve been working hard at Clarity, and it is okay to toot your celebratory horn every now and then. So without further ado, let’s hop right into our birthday recap!
Elevar & Clarity – Enabling Better Decision Making
Understanding data, conversions, and customer journeys are key to making informed adjustments as well as understanding how people are using your product or website.
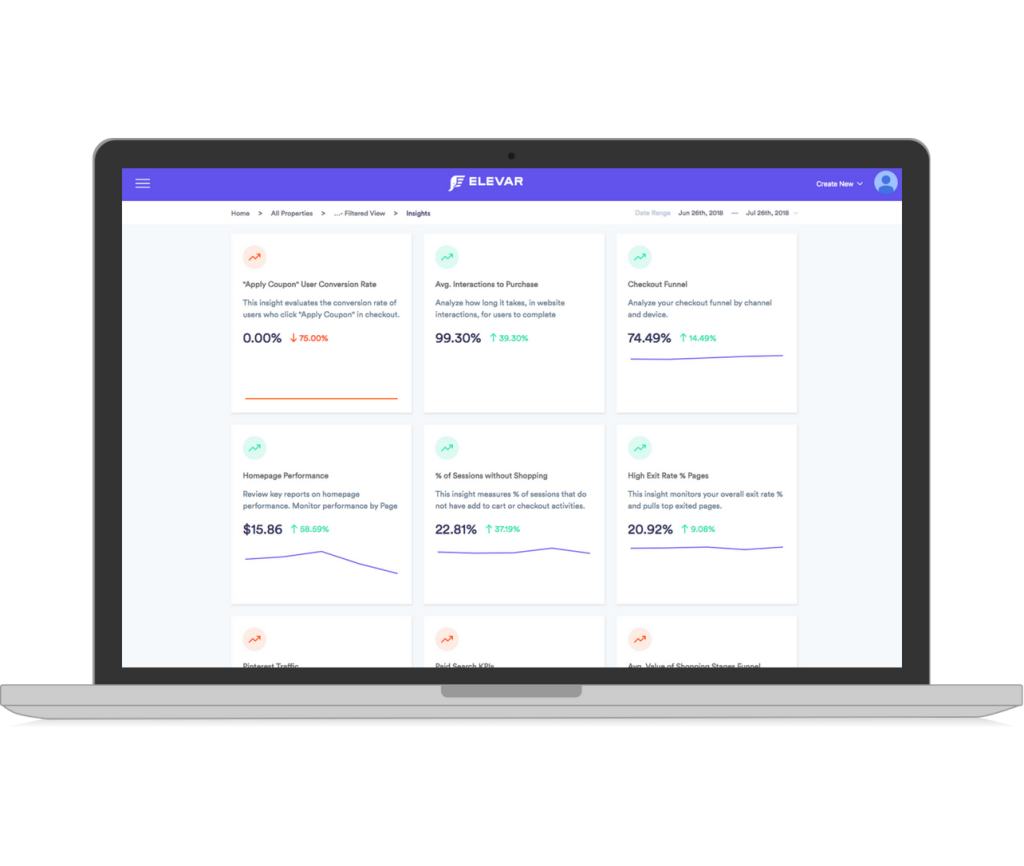
Elevar powers conversion tracking for direct-to-consumer brands on Shopify and Shopify Plus that rely on accurate data to make strategic business decisions. They do this by unlocking the latest in tracking methodologies with server-side tracking.
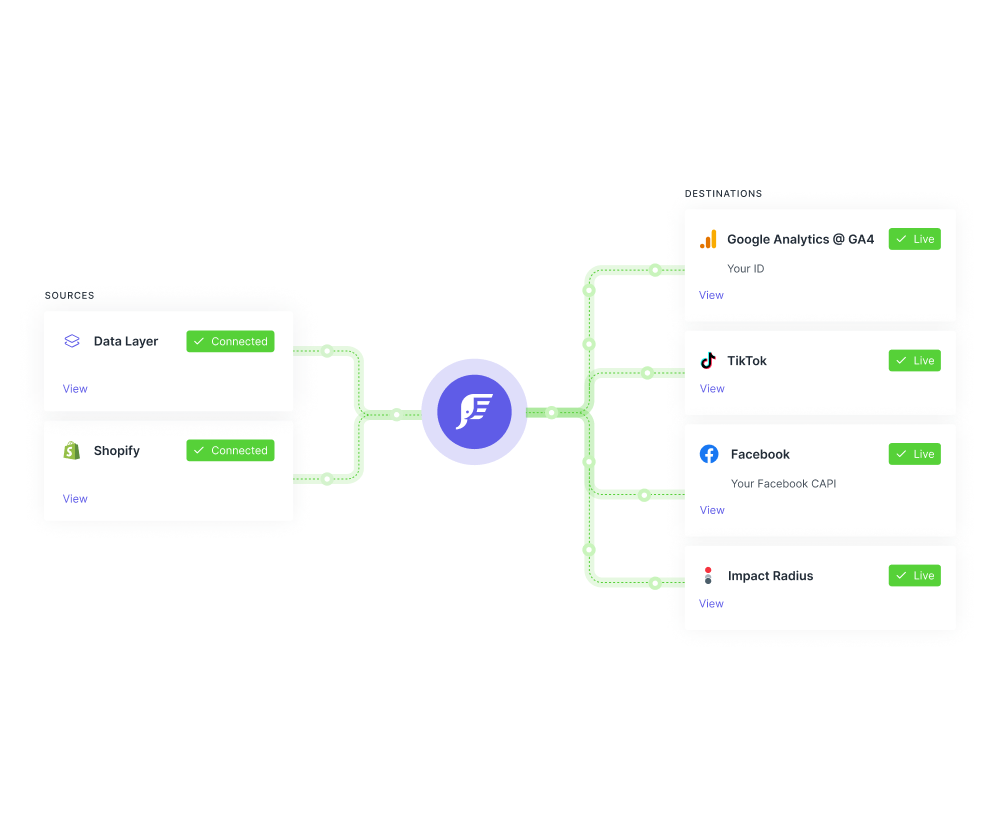
They transform shopping behavior into structured trackable events with attribution like UTM parameters, click ID’s, and customer data. You can connect your analytics tracking and marketing destinations like social media conversion APIs that rely on first-party customer data to match clicks to conversions. Once these events are captured, they can be directed to any ad or analytics platform the merchant relies on and needs to connect with in the format required by those platforms.
Once live, Elevar pushes 100% of consumer shopping and conversion data to the marketing channels. This data helps optimize the algorithms used by these channels to improve ad performance.
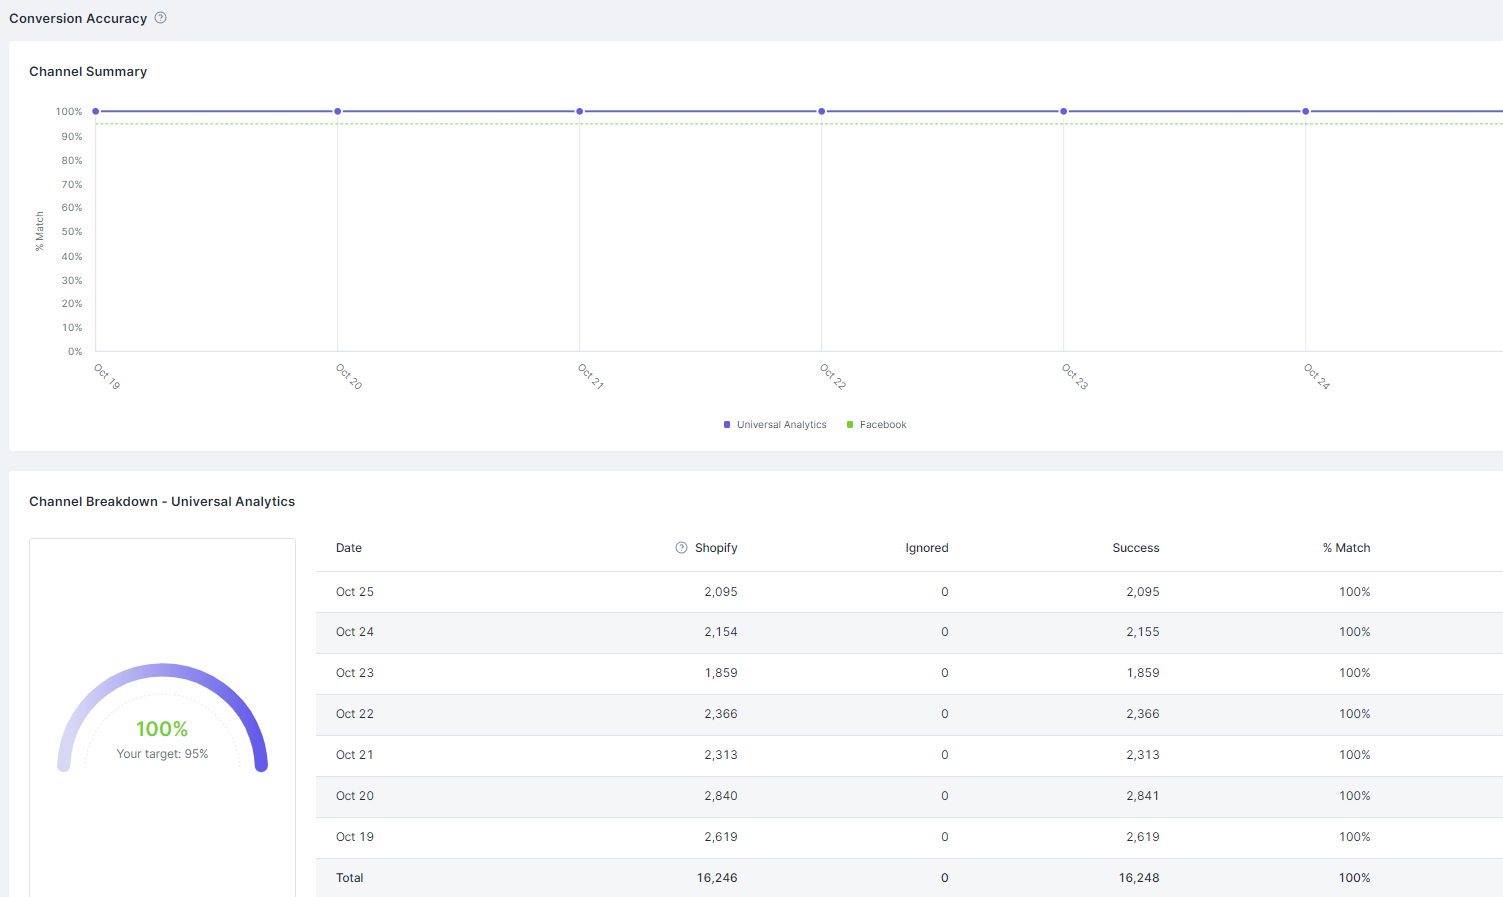
Elevar also has tag error reporting, channel accuracy reporting (to ensure all channels receive the data collected), and some attribution reporting.
Elevar offers an integration with Microsoft Clarity, adding behavior analytics insights in the form of Heatmaps, Screen Recordings, and behavior-focused insights. By combining Elevar’s conversion tracking capabilities with Clarity’s behavior analytics insights, you’ll be able to make better data-driven decisions as a marketer, analyst, or Shopify brand owner. Here’s how to get started with adding Clarity to Elevar.
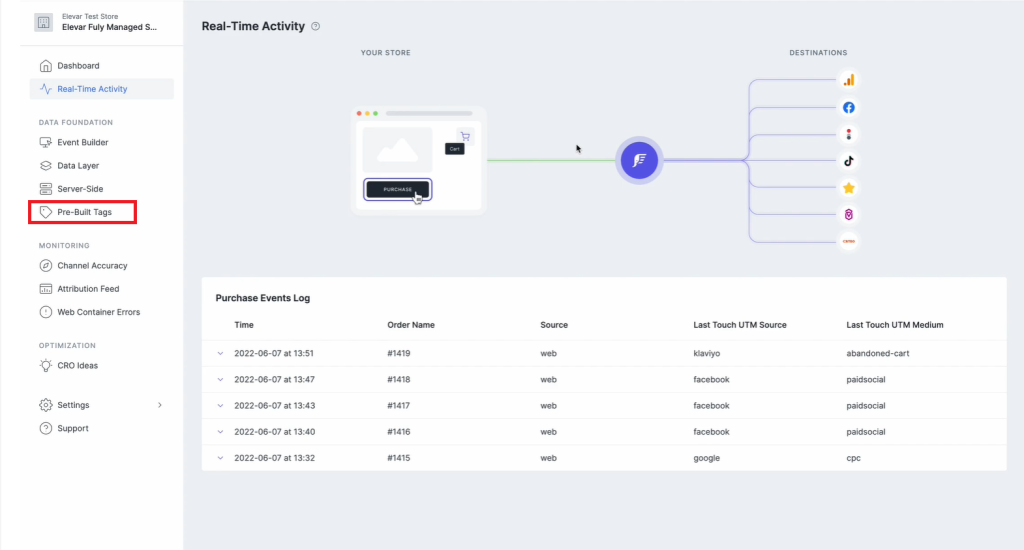
Step 1:
In your Elevar App, go to Pre-Built Tags.
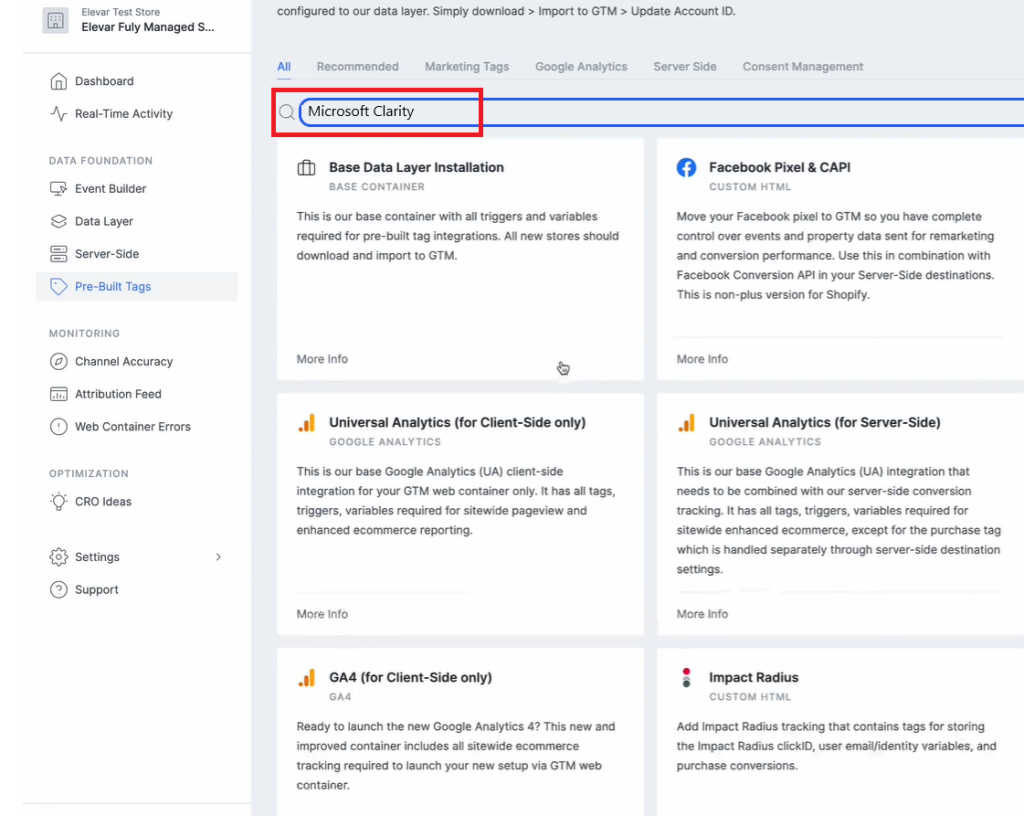
Step 2:
In the Search bar, search for Microsoft Clarity.
Step 3:
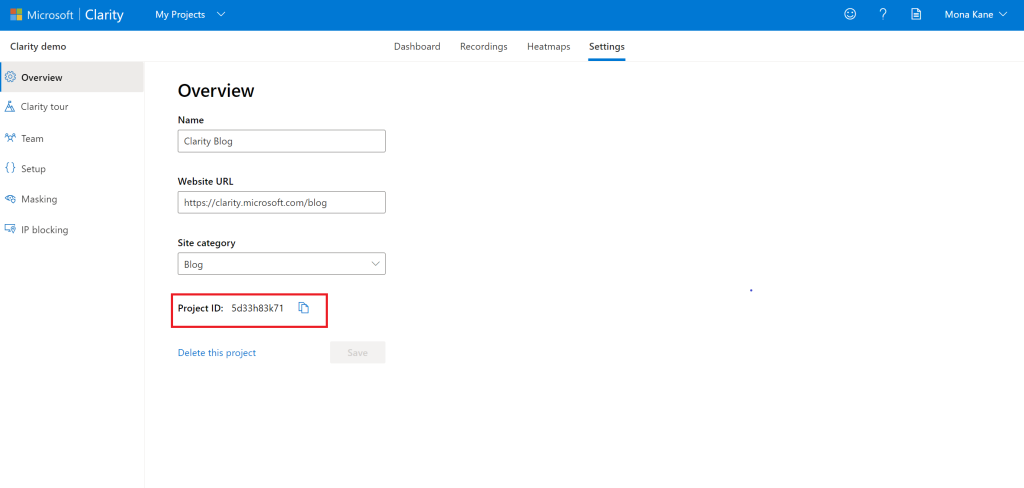
Locate your Clarity Project ID and copy it by following the below instructions:
From the Clarity dashboard, go to Settings.
Select Overview from the left panel.
Copy the Project ID (for example, 55u86t0118).
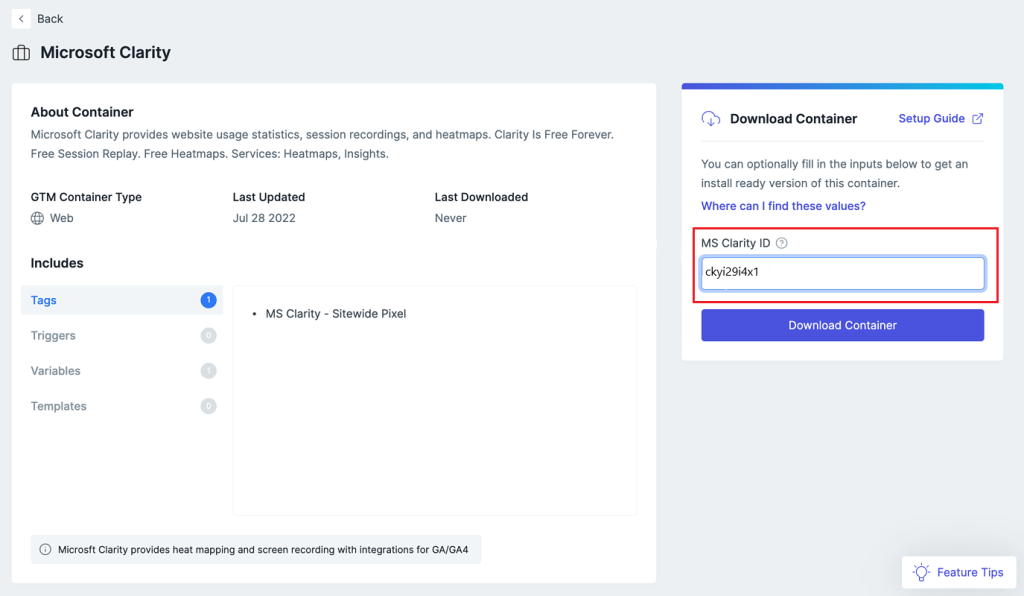
Step 4:
Paste the Clarity Project ID into MS Clarity ID. Select Download Container.
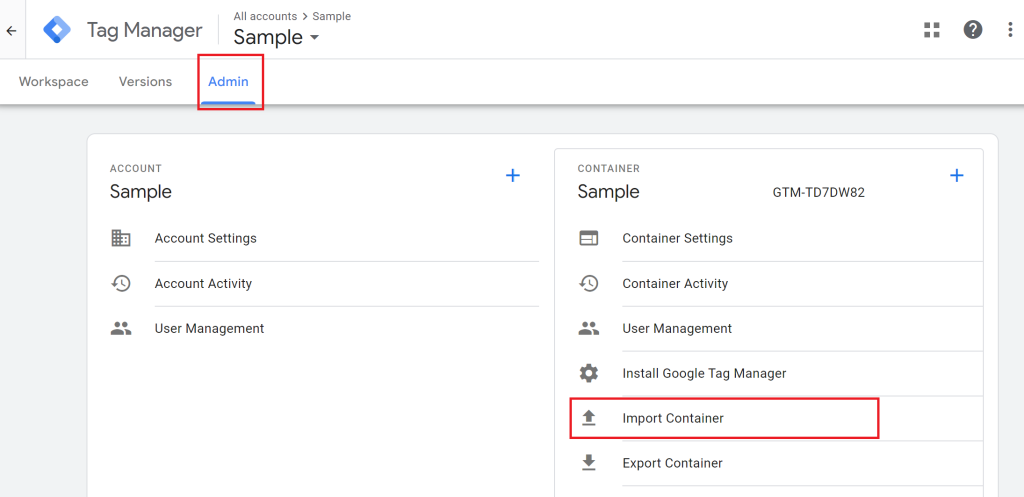
Step 5:
Sign in to your Google Tag Manager Account. Go to GTM Web Container. Select Admin > Import Container.
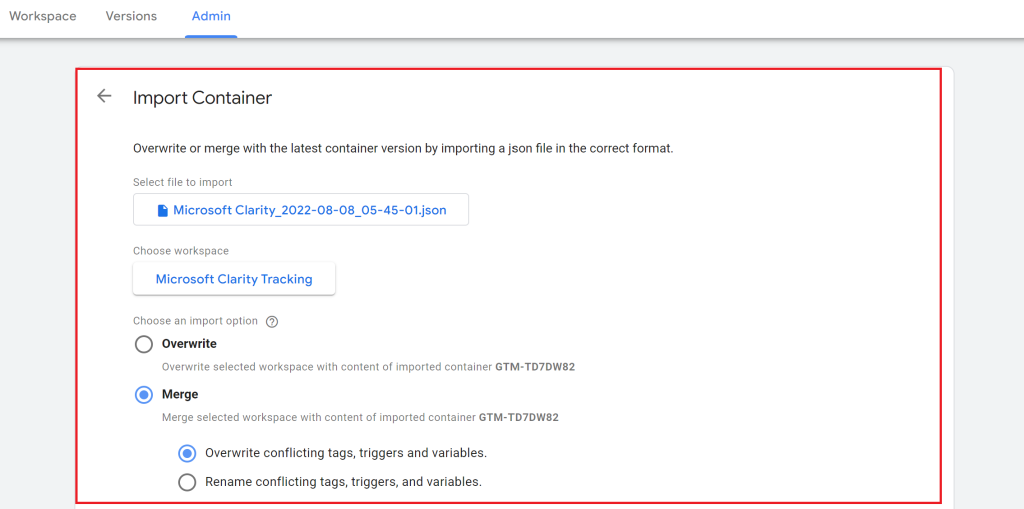
Step 6:
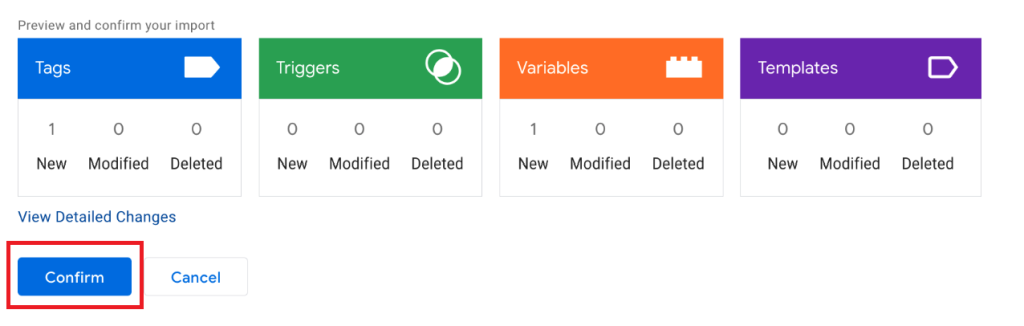
Select to import the file you downloaded in Step 4. Create a New Workspace and name it Microsoft Clarity Tracking. In Choose an import option, select Merge > Overwrite conflicting tags, triggers, and variables.
Select Confirm to import tags.
Step 7:
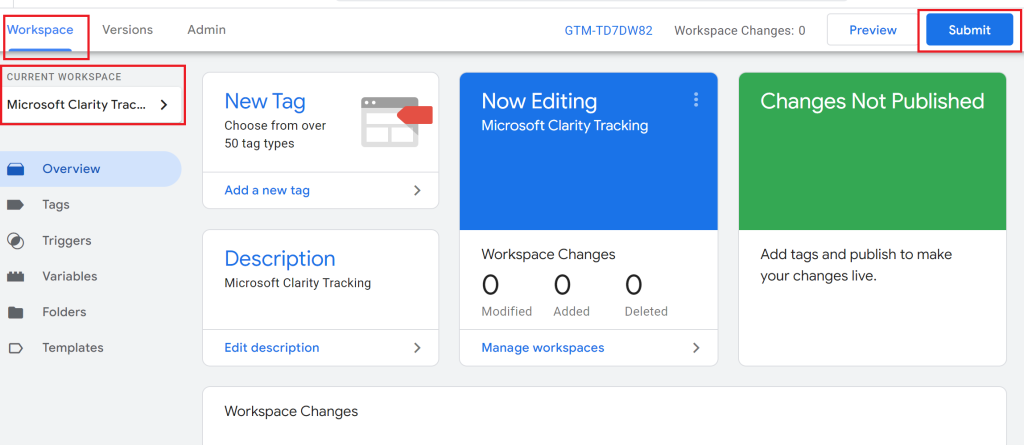
Go to Workspace. Select Microsoft Clarity Tracking in CURRENT WORKSPACE.
Select Submit.
Step 8:
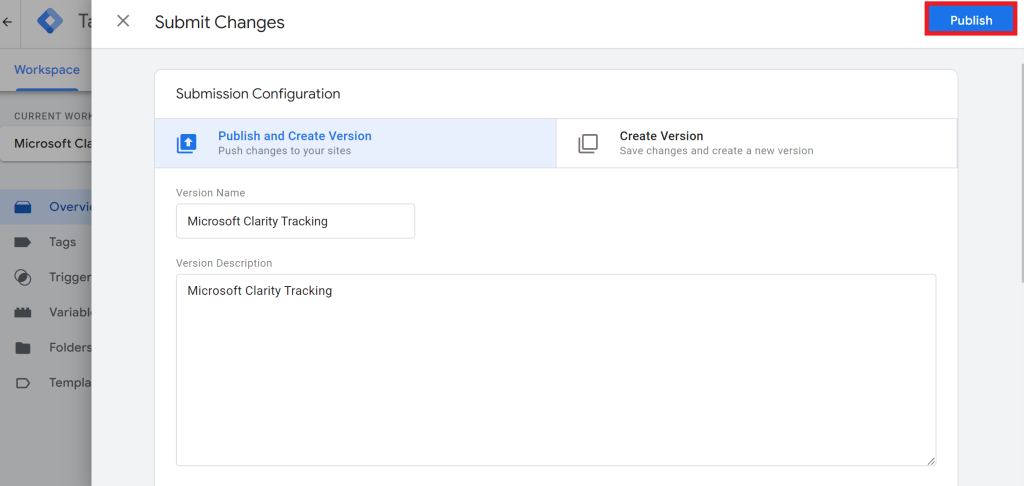
Select Publish to save Submission Configurations and set your tracking live.
Start viewing Recordings, Heatmaps, and Dashboard data in a few hours.
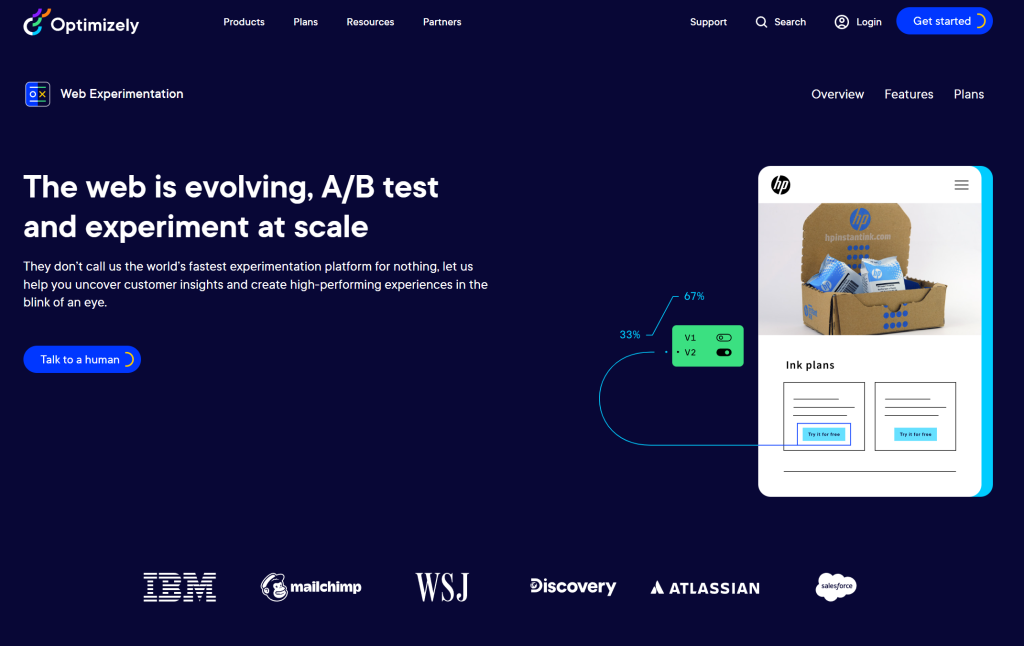
Optimizely on the Web lets you run A/B tests and experiments at scale. Optimizely Web Extensions are reusable templates that developers can use to create custom features for non-technical teams. It is an optimization platform that provides a way to test, validate changes, view analytics, and modify the default behavior of web pages to allow you to grow your business.
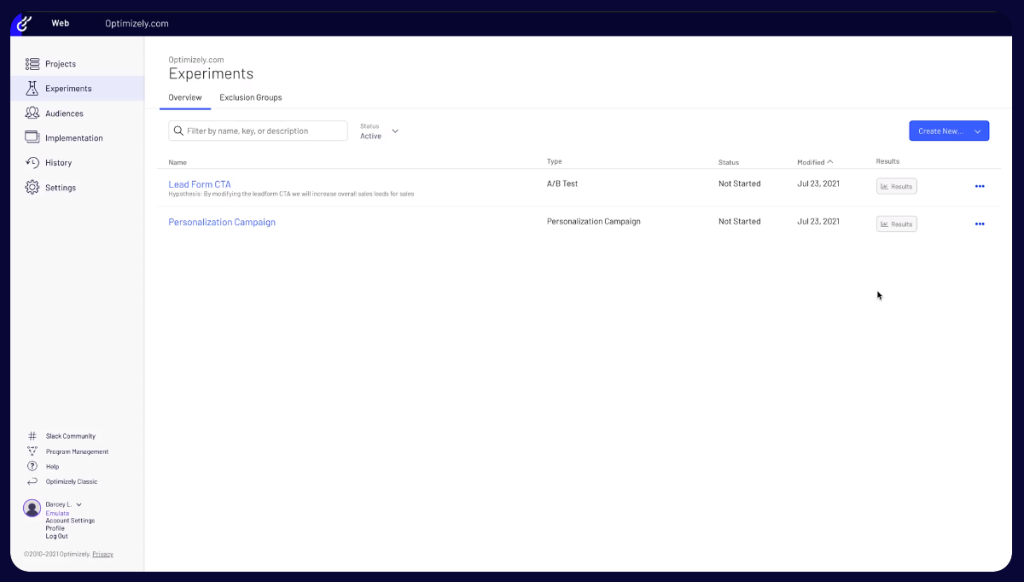
The Optimizely Web platform enables you to add and manage various experiments, as seen below.
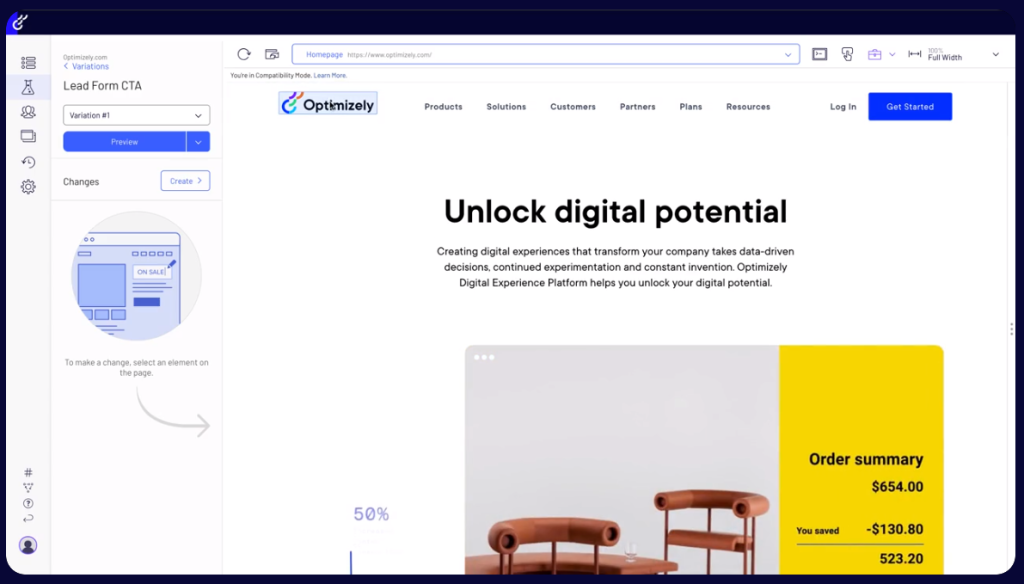
The visual editor allows you to implement changes on your site in minutes to change the experience of your customers. Quickly adapt to through experimentation to accelerate success, get ahead, and stay there.
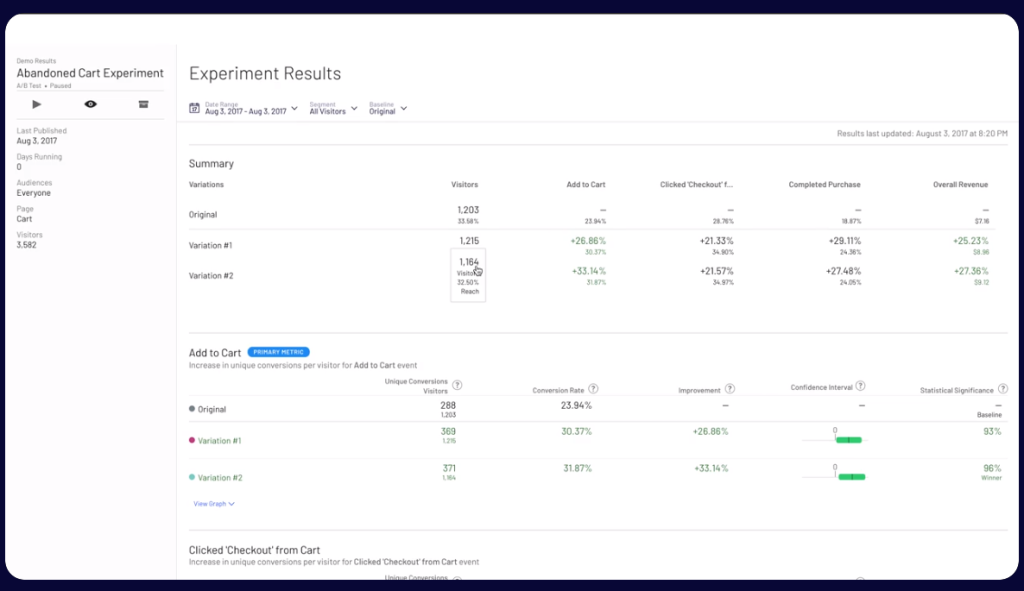
Also, quickly see analytics results all in one place.
Optimizely has added integration with Microsoft Clarity. Adding Clarity offers some great benefits.
The opportunity to see behavior analytics across your website, enabling users to make key changes which would be otherwise elusive.
This includes the use of Heatmaps, Clickmaps, and Sessions Recordings to see how users interact with your site, which is critical to understanding what changes to implement and why.
You can also easily see Rage Clicks, Dead Clicks, Quickbacks, and other points at which users get frustrated.
Here’s how to get started adding Clarity to Optimizely.
Step 1
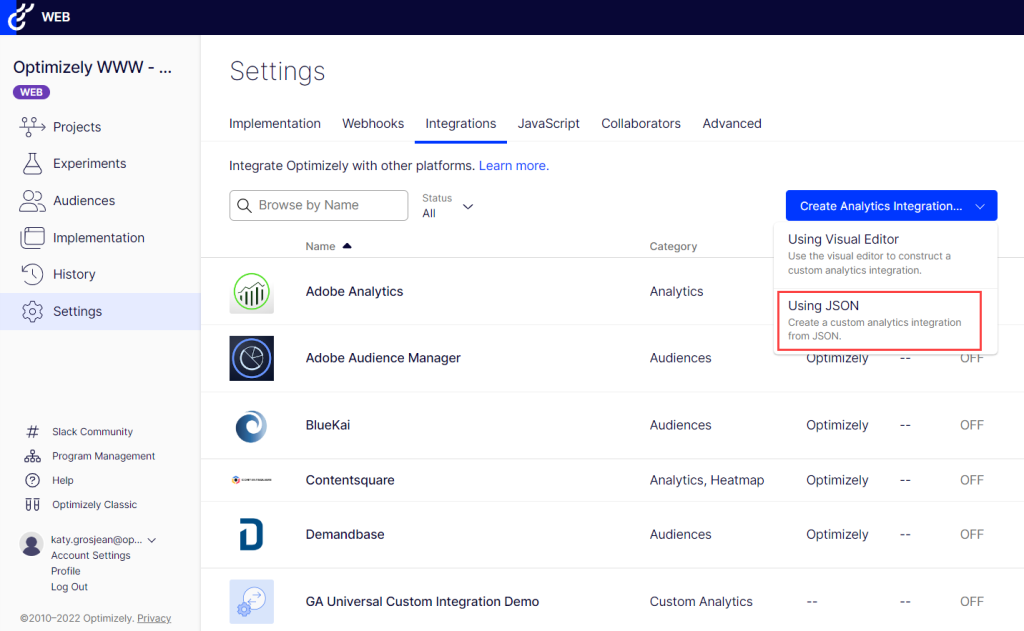
Sign in to Optimizely. Go to Settings > Integrations.
Expand the Create Analytics Integration drop-down list and select Using JSON.
Step 2
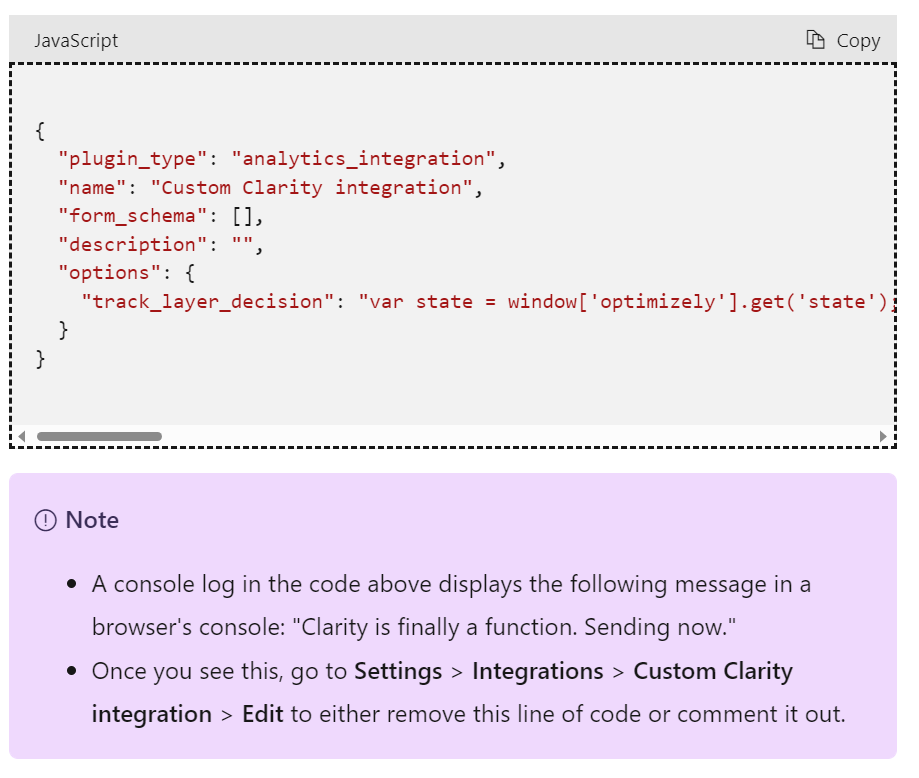
Paste the following code into the JSON field and select Create Extension.
Step 3
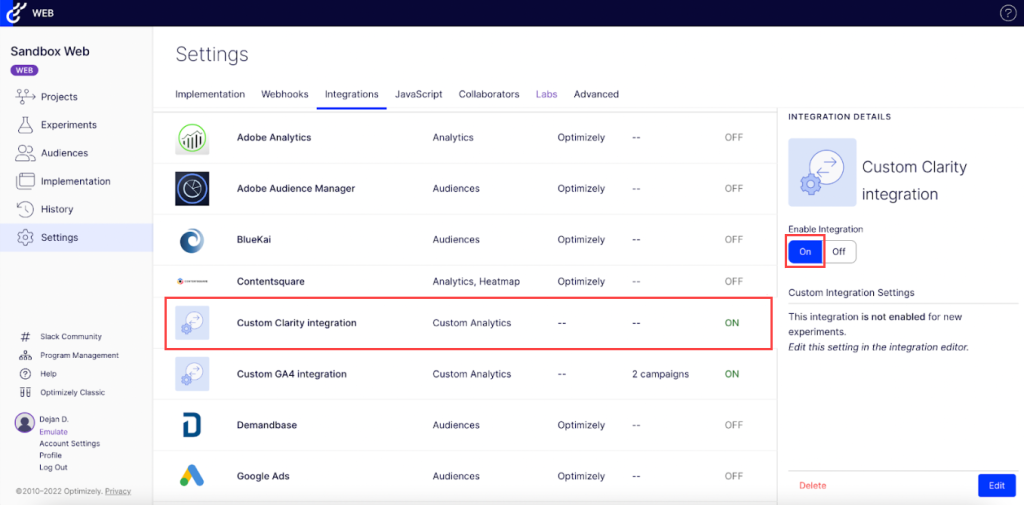
Go to Settings > Integrations page to view the custom integration you just added. Select Custom Clarity integration from the list and turn OnEnable Integration.
Step 4
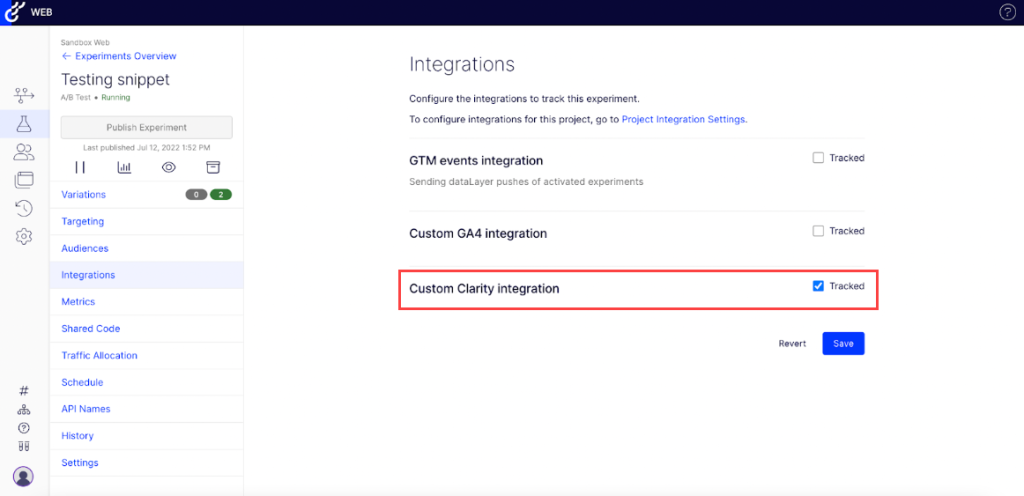
You can add the new integration to specific experiments in two ways:
Manually add new experiments
Add the new integrations to specific experiments as shown below:
Automatically add new experiments.
Automatically add to all new experiments using the following steps:
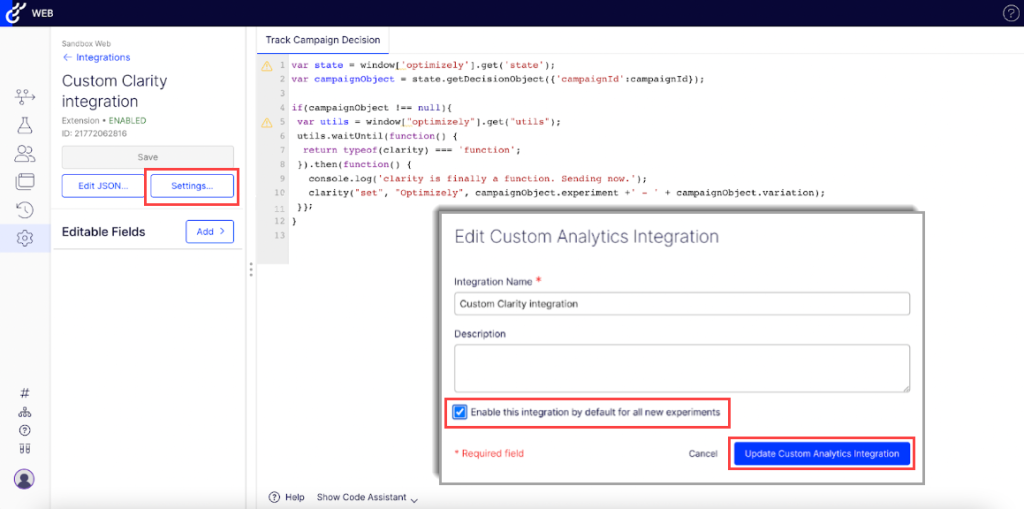
Go to Settings > Integrations > Custom Clarity integration.
Select Edit.
Select Settings. The Edit Custom Analytics Integration window displays.
Check Enable this integration by default for all new experiments box.
Select Update Custom Analytics Integration to save the changes.
Step 5
Use the experiment data in Clarity:
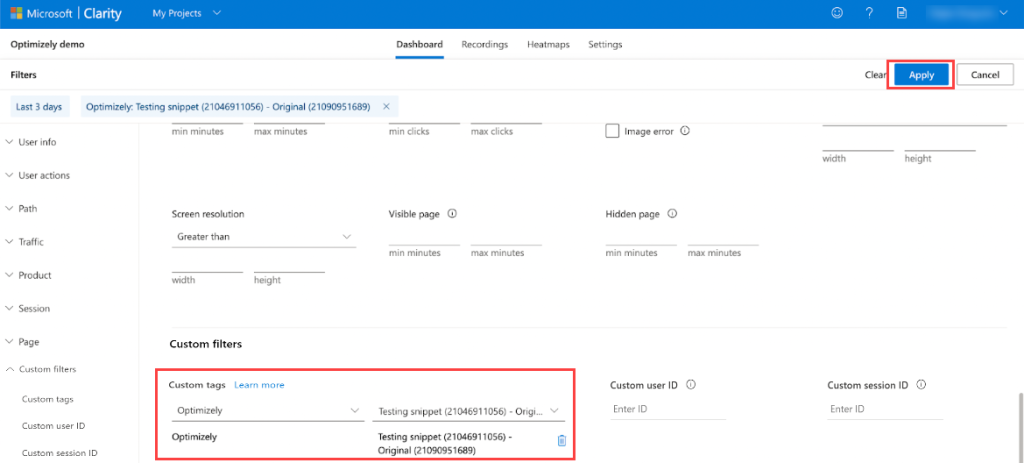
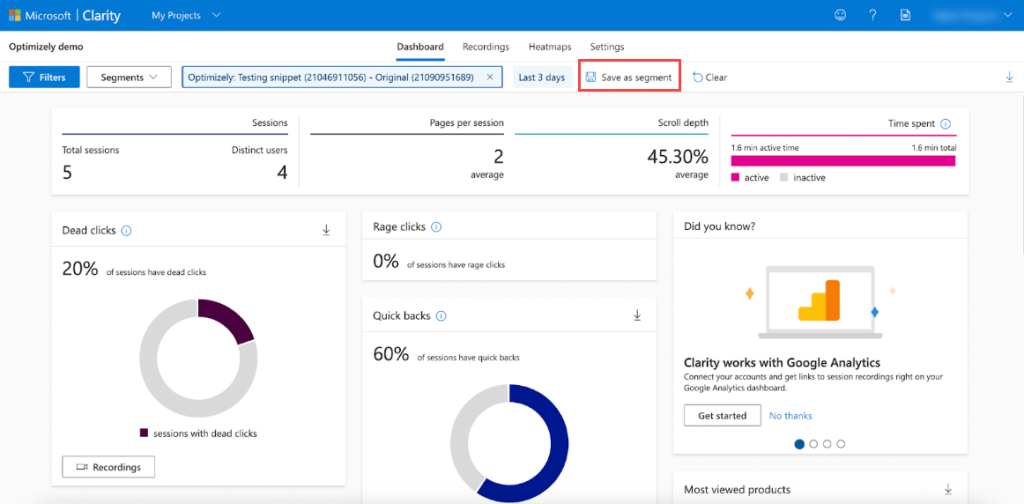
Go to your Clarity dashboard and select your desired project.
Go to Filters > Custom filters > Custom tags.
Select Optimizely from the drop-down and your desired experiment/variant.
Select Apply.
Select Save as segment to save this custom filter as a segment.
Select Save as segment to save this custom filter as a segment.
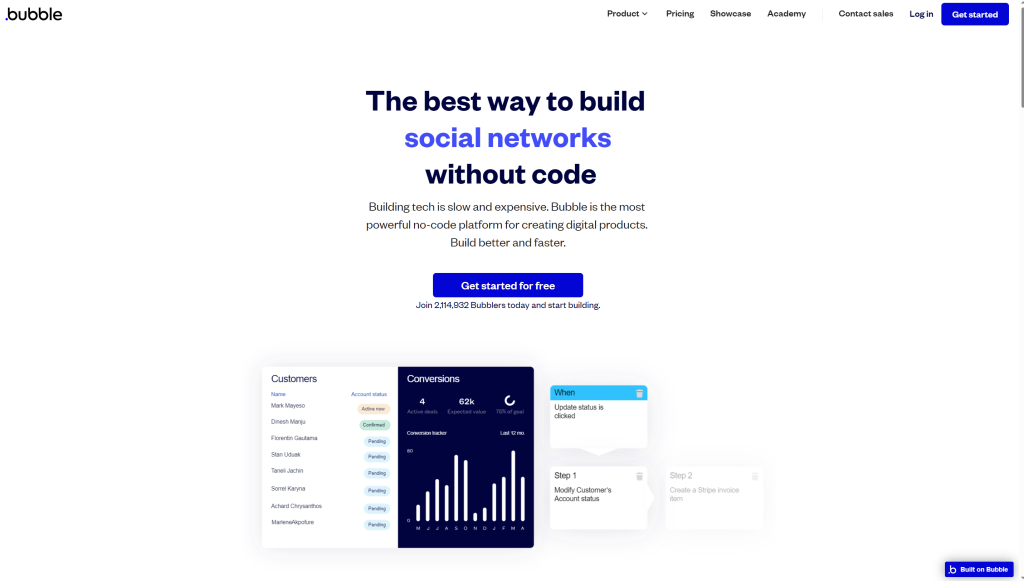
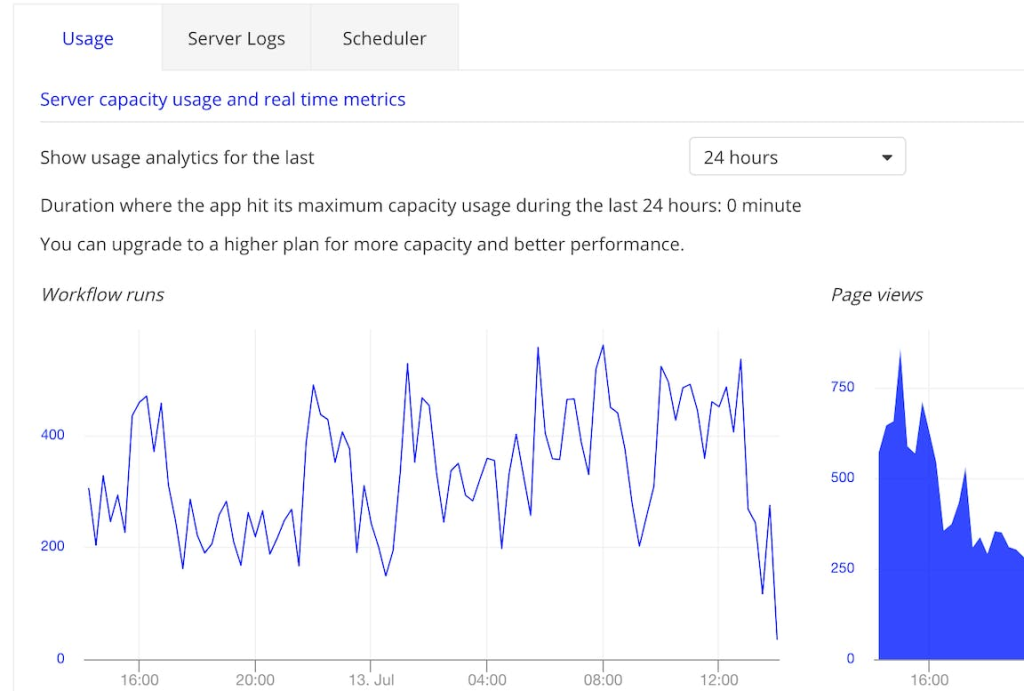
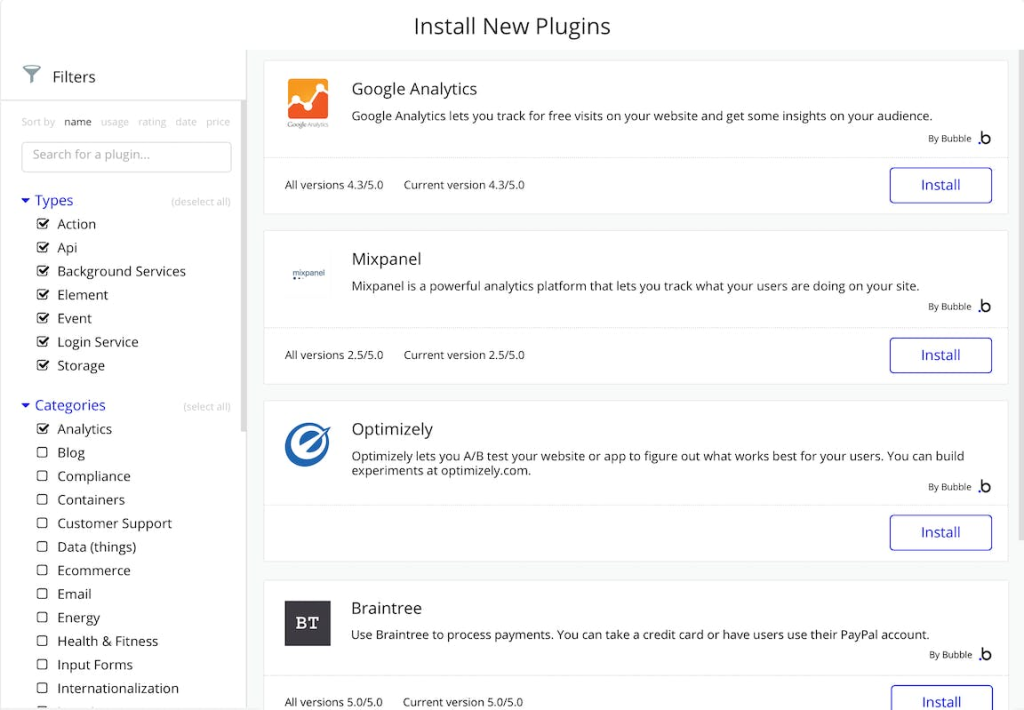
Learning code is hard, but building tech is easy with Bubble, a visual programming language that lets you build web applications without code. With Bubble, you can build anything such as a marketplace, a social network, or even a CRM.
Bubble has a generous and expansive drag-and-drop interface that allows for creative use of dynamic content. Their builder catalog also has all the elements you might need to design the perfect website.
Never worry about how to get your site up and running, as Bubble comes with robust hosting features! There are also no limits on the number of users, traffic volume, or data storage—we’re all about no limits at Clarity!
Bubble also helps with growth, engagement, and measurement with services like email and SEO that integrate with tools you already use. You’ll be able to measure and track behaviors to make better decisions as your product and business evolve.
Bubble offers many other great features, such as collaboration, a responsive design, a marketplace of templates, and powerful security.
Newly added is the integration with Microsoft Clarity! By combining Clarity with Bubble, you’ll be able to capture how real people use your custom website utilizing Heatmaps, Session Recordings, analytics insights, and integrations with popular tools such as Google Analytics.
Simply put, easily build websites and web applications using Bubble and learn how customers interact, navigate and explore your website using Microsoft Clarity. Easy web development with easy behavioral analytics.
Here’s how to get started:
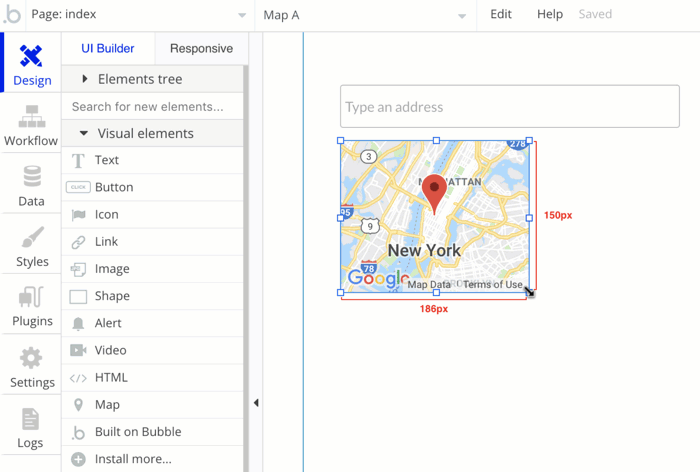
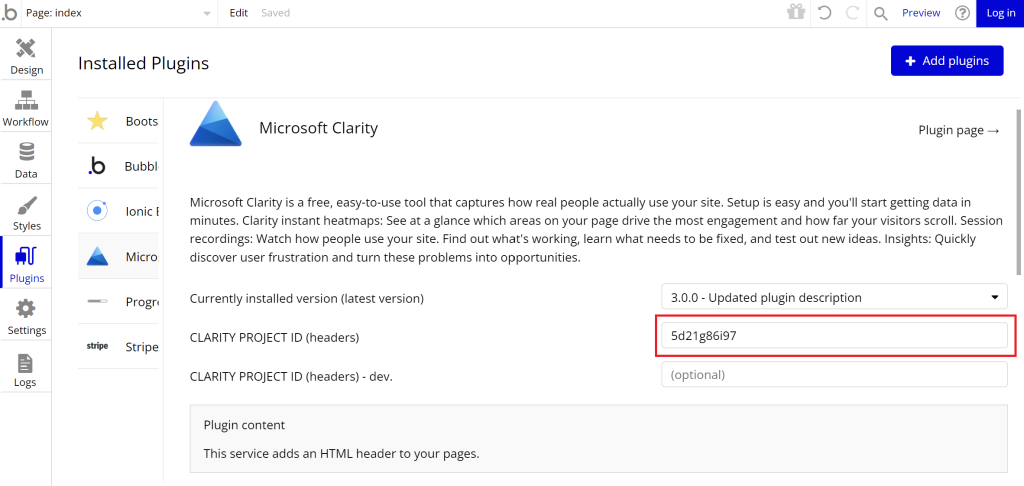
Step 1:
In your Project Settings, Overview section, notice the “Project ID”, for example “d0hgqtuduv”
In plugin tab, enter your Microsoft Clarify Project ID.
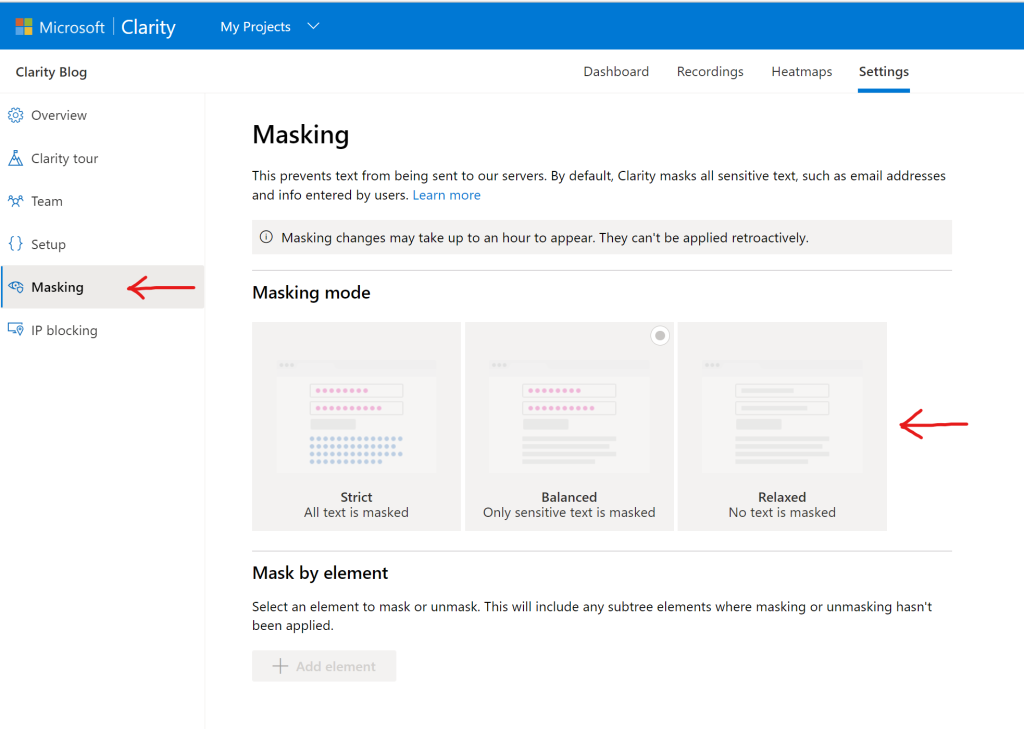
Step 3:
If you have trouble capturing all your users’ interactions, set in Settings > Masking > Relaxed setting
After integrating Clarity with Bubble, behavior analytics insights will begin populating, and you’ll be able to enjoy the benefits. As always, if you have any questions, you can reach us at clarityms@microsoft.com or on social media.
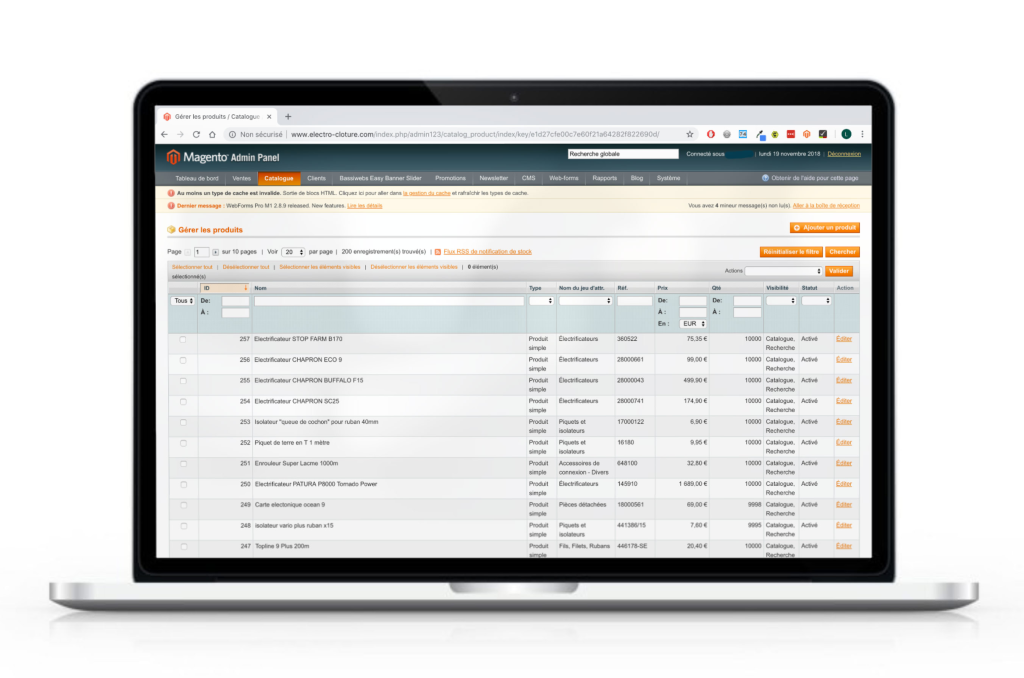
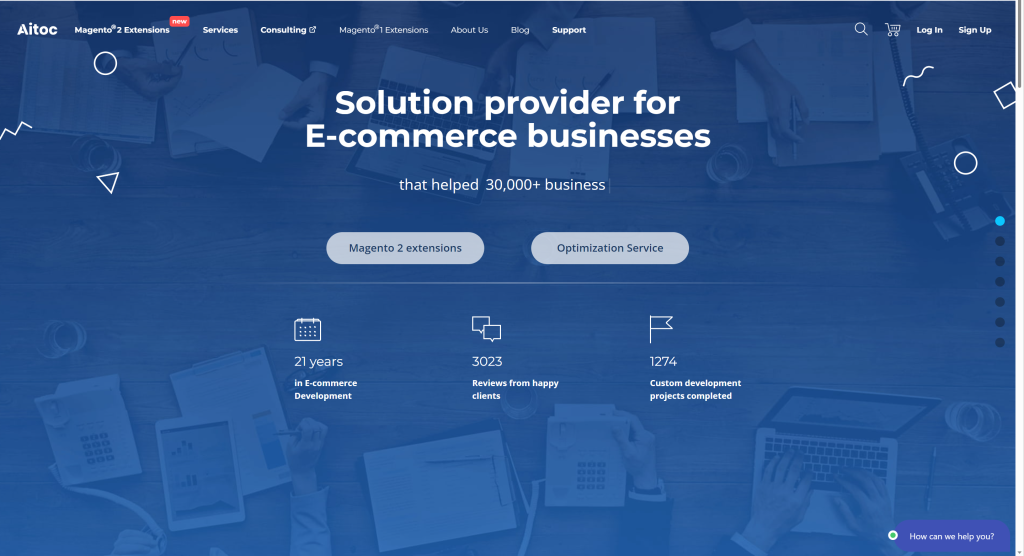
AITOC is a world-leading provider of custom solutions for Magento. They are one of the few companies that have been creating Magento extensions since the very launch of the ecommerce platform. Magento is a powerful and flexible, customizable ecommerce platform that currently powers 1.2% of sites on the Internet. There are over 200,000 Magento developers around the world, and e-commerce businesses attribute 10–80% of their revenue uplift to Magento. Magento is a feature-rich ecommerce solution with built-in PHP that provides online sellers with complete flexibility and control over their stores’ functionalities and appearance– it’s understandable why companies such as Nike, Samsung and Land Rover all use Magento.
It’s advantageous to customize your online store with high-quality extensions, add-ons, modules, apps & plugins designed specifically for the Magento. Adding plugins can help keep your inventory organized, help track deliveries, expand your business, and cut down on the cost of website development.
AITOC offers a FREE Microsoft Clarity extension for Magento 2 for both community and enterprise. No code changes are required to configure the extension and start using Clarity integration.
For ecommerce online sellers, Clarity is a no-brainer as it offers powerful data and insights into customer behavior. You’ll quickly be able to view Heat Maps and Click Maps which show what users want and how you can play around with design to get more attention from them on specific items. With Clarity installed on your ecommerce site you’ll be able to:
Identify places of user frustration with insights like rage clicks
Find product bugs on your ecommerce site that can damage the user experience
Explore potential issues with specific user groups identified by Clarity
With Session Recordings watch how users navigate your ecommerce site, when you lose them, or if they experience pain points. You can also easily narrow down what you want to watch with filters:
Sort by user location, browser, session duration, campaign
Create custom filters to explore scenarios specific to your store
See recordings for your Google Analytics segments too
To learn more about how to install Clarity on AITCO visit our documentation page here.
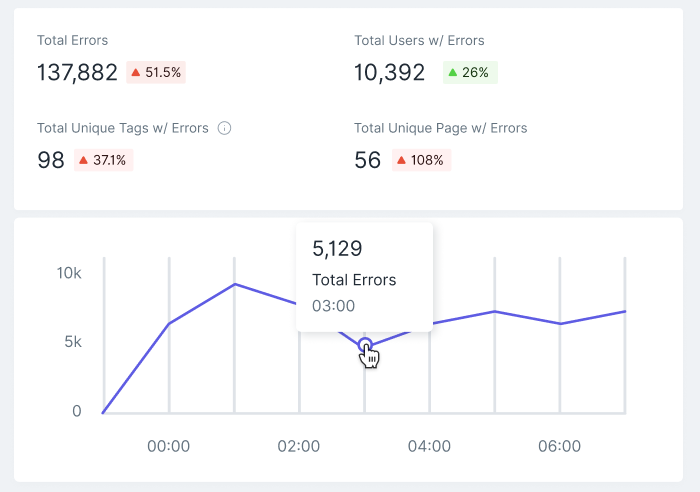
JavaScript errors (or JS errors) are pesky things—they occur frequently, may interfere with your site visitor’s user experience, and are often hard to understand or debug. That’s why Clarity has made some big updates to help you out here. Today, we’re excited to announce:
JavaScript error details
Click Errors metric
Our data shows that on average, 9% of a site’s sessions have JavaScript (JS) errors. Let’s say you try to fix them and dig into your errors more, you’ll run into two main challenges:
There are hundreds of different error types.
Not all errors are actually user-impacting.
Let’s walk you through how to use our new feature to address these.
JAVASCRIPT ERROR DETAILS
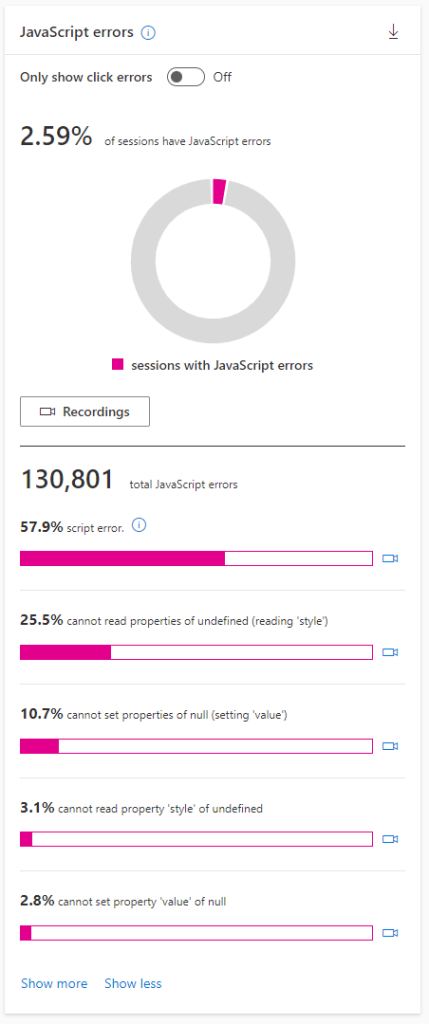
Not all JavaScript errors are the same—they can vary greatly based on user details (like browser, OS, country), different parts of your script, etc. To debug your JavaScript errors, you must first break them down into specific JS error types. We’ve made this easy for you by showing within your Clarity dashboard a breakdown of your JS error messages, sorted by frequency. This will make your software engineer’s life much easier.
TOP JS ERRORS ON CLARITY PROJECTS
Across all Clarity projects, we do also see some common error types—if you have one of the following, you’re not alone:
Illegal invocation error (7.4% of projects)
This is typically caused when the “context” of a function is lost. In other words, a function’s keyword is not referring to the object it originally did.
ResizeObserver Loop Limit exceeded (5.7% of projects)
This means that your ResizeObserver wasn’t able to deliver all observations in a single animation frame. This error is typically not user-impacting and can be safely ignored.
We also observe with JS errors, low effort typically yields a high reward. Our data shows that >30% of Clarity projects have a single error responsible for more than 50% of all script error issues. This means that resolving just one error type could result in a substantial improvement across your site and your users’ experience!
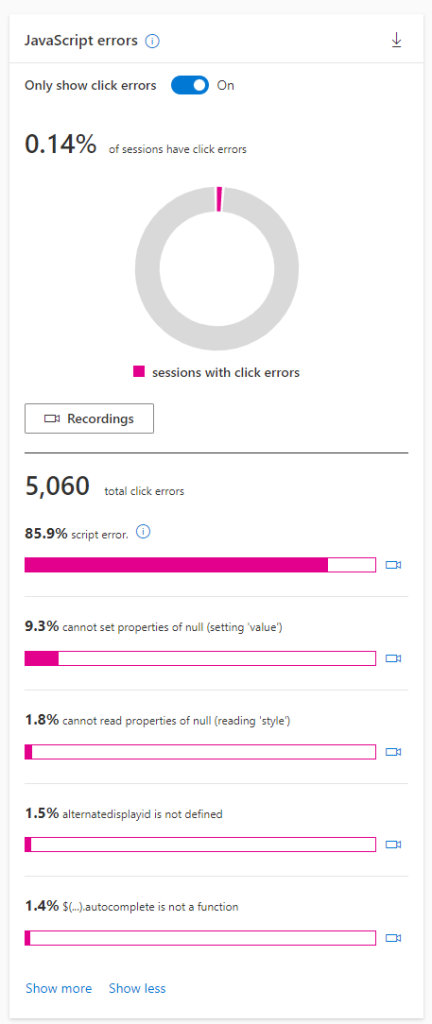
CLICK ERRORS
As you start fixing the errors, you may notice that not all JavaScript errors have the same root cause. Some errors fire from minor data bugs that you already know about. Some other errors fire from user-related actions that may cause an unusable website.
To help you pinpoint these errors associated with user clicks, Clarity has introduced a new Click errors metric. This metric narrows down the JS errors to only a specific subset that occurs after a user click. See your Click Errors by clicking on the toggle at the top of the JavaScript error widget:
CONCLUSION
JavaScript errors are important to pay attention to, as they can be early indications that something on your site is wrong. With Clarity’s new JavaScript error details and new Click error metric, you can now see the specific error messages contributing to JS errors and identify errors associated with clicks. We hope these features go a long way in helping you reduce and minimize the coverage of JS errors on your website!
Let us know your thoughts—we always welcome feedback!
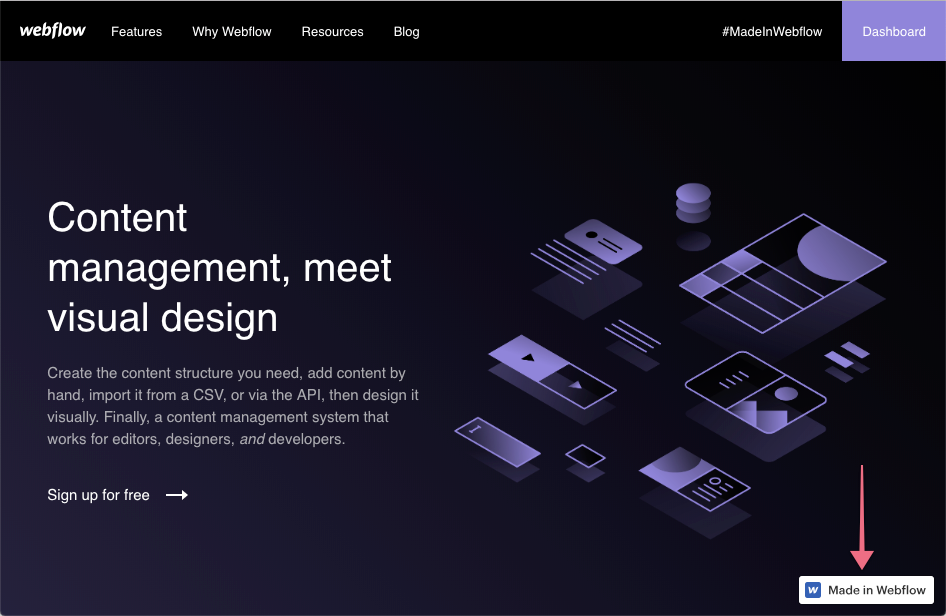
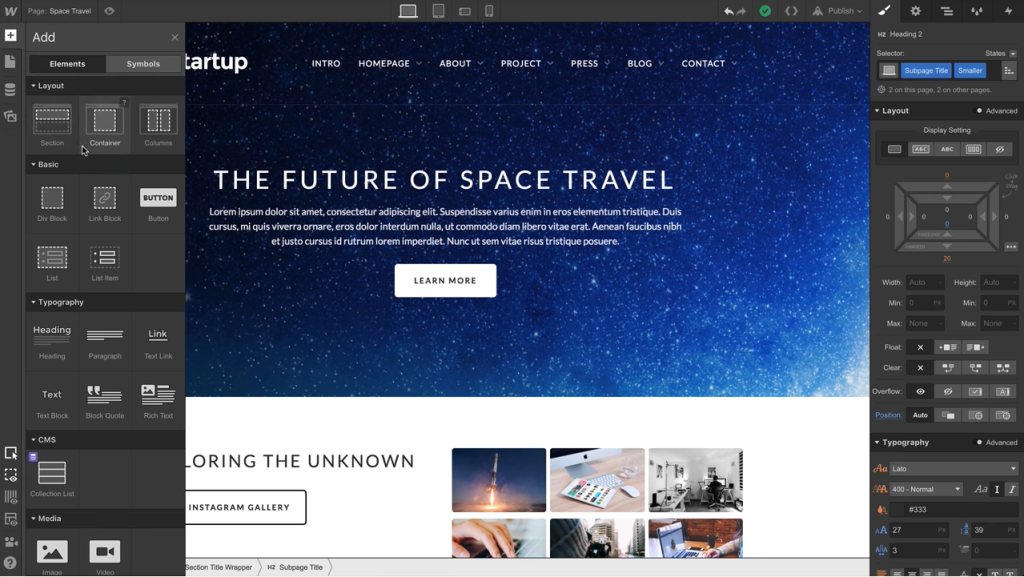
Webflow is an easy to use website canvas creation tool anyone can get the hang of quick. The canvas tool can create interesting and powerful websites with useful interactions, integrations, visuals and more.
Webflow is popular among all types of people, from business owners and marketers to designers and music artists. The platform has a fully functional CMS (content management system) that allows you to manage and also publish content like blogs, products, videos and more.
Webflow also has a vast array of templates to choose from as well as the full power of HTML, CSS, and Javascript in a visual canvas.
Webflow has added integration with Microsoft Clarity to make your experience building and operating a website more successful with user behavior analytics. Here’s how to get started with Clarity.
The first thing you need to do is locate your Clarity Project ID and copy it by following the below instructions:
Step 1
From the Clarity dashboard, go to Settings -> Overview.
Copy the Clarity tracking code from your specific Clarity project.
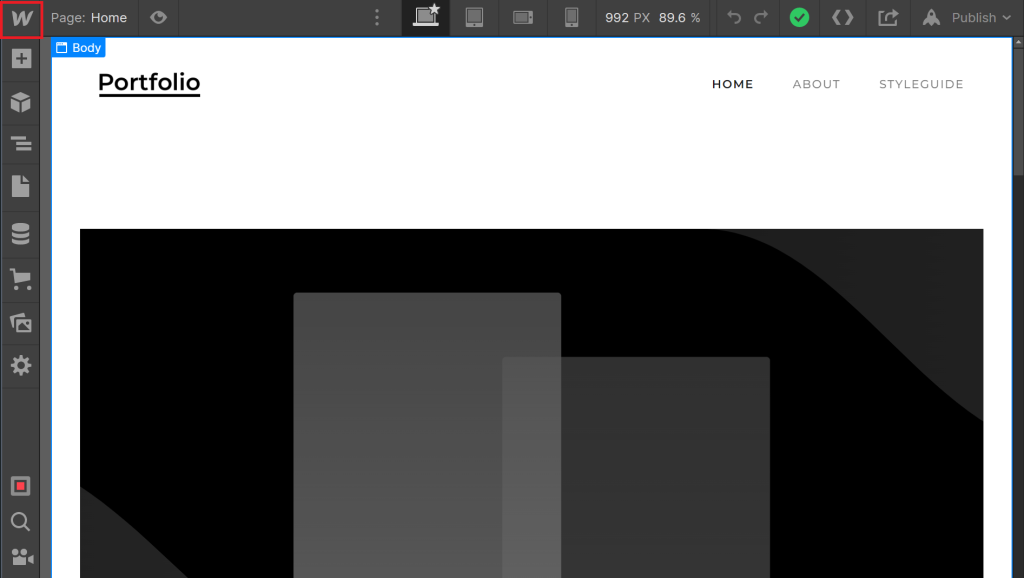
Step 2
Go to Webflow dashboard. Select the Webflow icon in the top left of the dashboard.
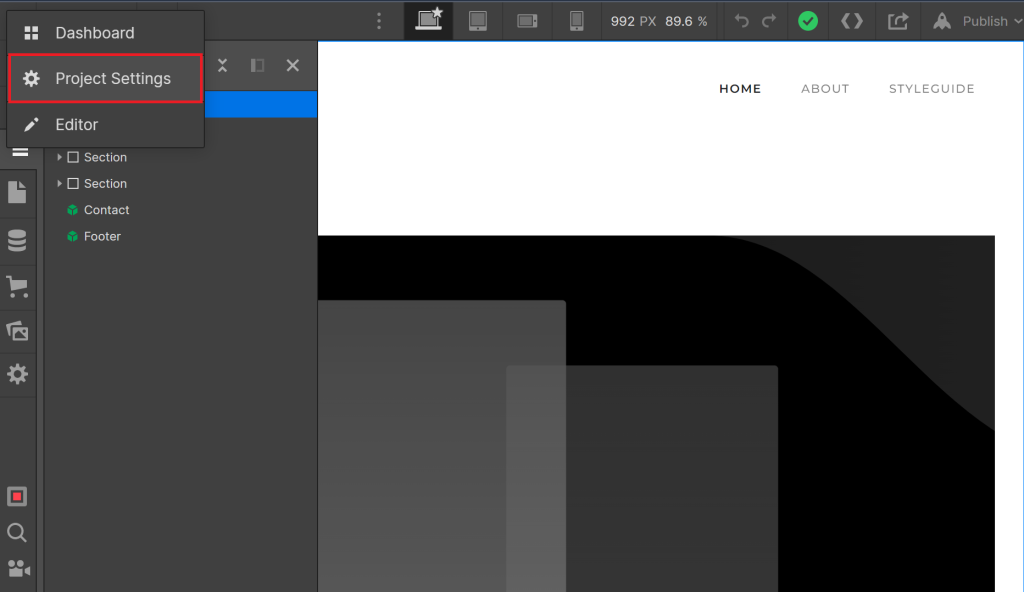
Step 3
Select Project Settings.
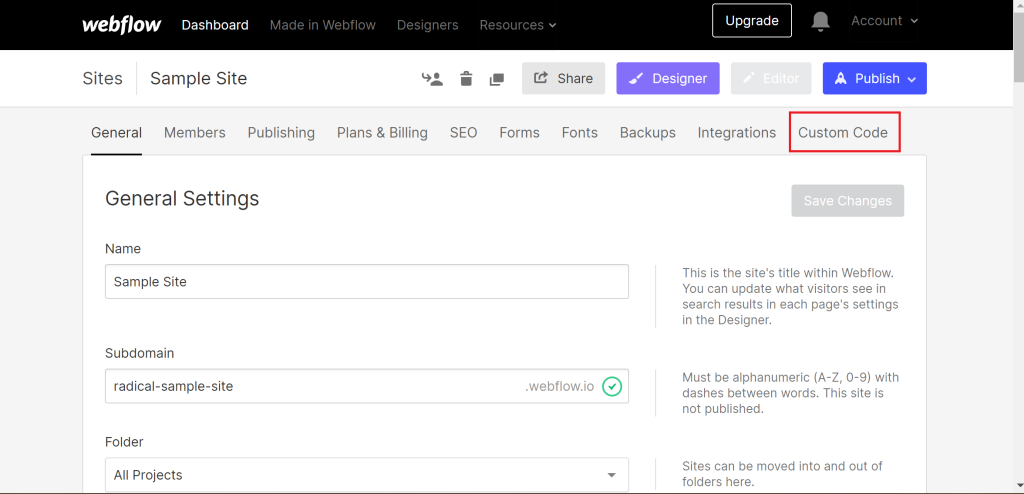
Step 4
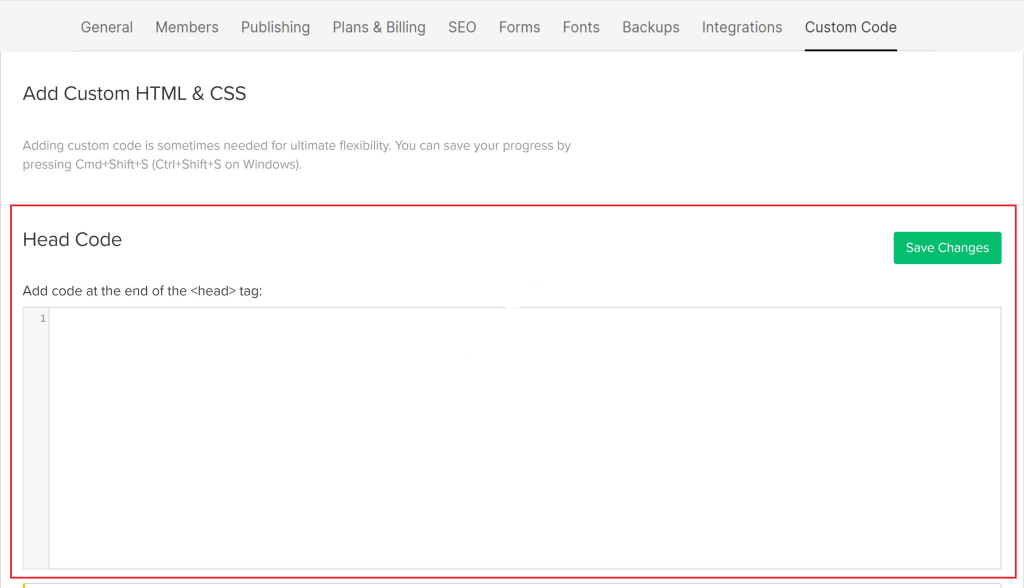
Select Custom Code.
Step 5
Paste your Clarity Tracking Code into the Head Code box. Select Save Changes.
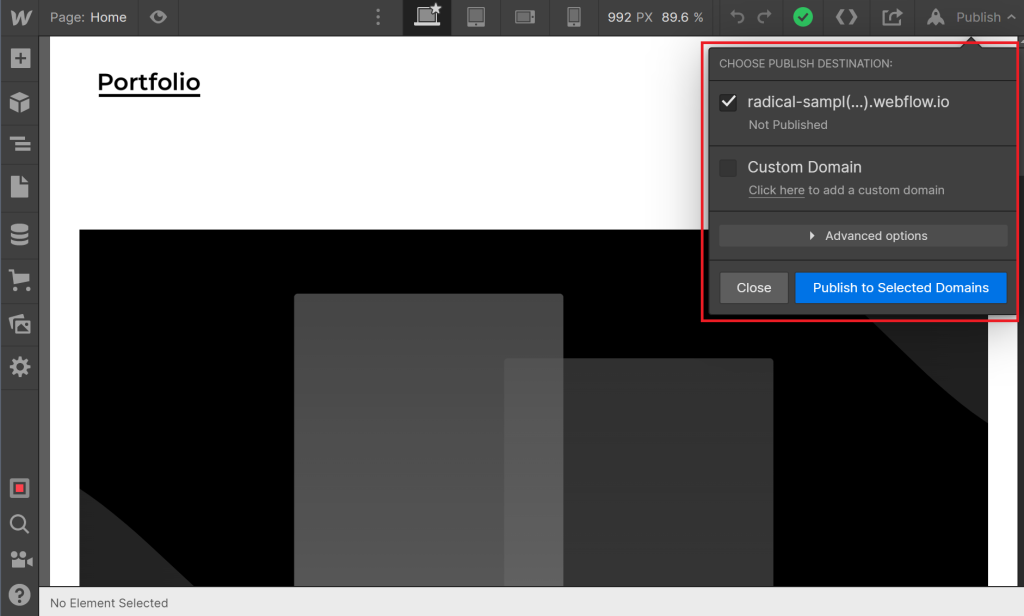
Step 6
On your project settings page, choose Publish. From the drop-down, select a Domain for the site listed in Clarity. Select Publish to Selected Domains.
Once setup you’ll be able to see Sessions Recordings, Heat Maps, traffic sources, visited pages, and more. With these insights, developing an intuitive website for your customers is much easier. By being able to directly see their user journey making swift changes to your website, and a/b testing in in the early stage is a breeze.
One of the benefits of Clarity is being able to dial in the interface to fit your needs when it comes to analytics, reporting and visualizations. We are excited to announce a new update to Clarity that will add further functionality for custom IDs.
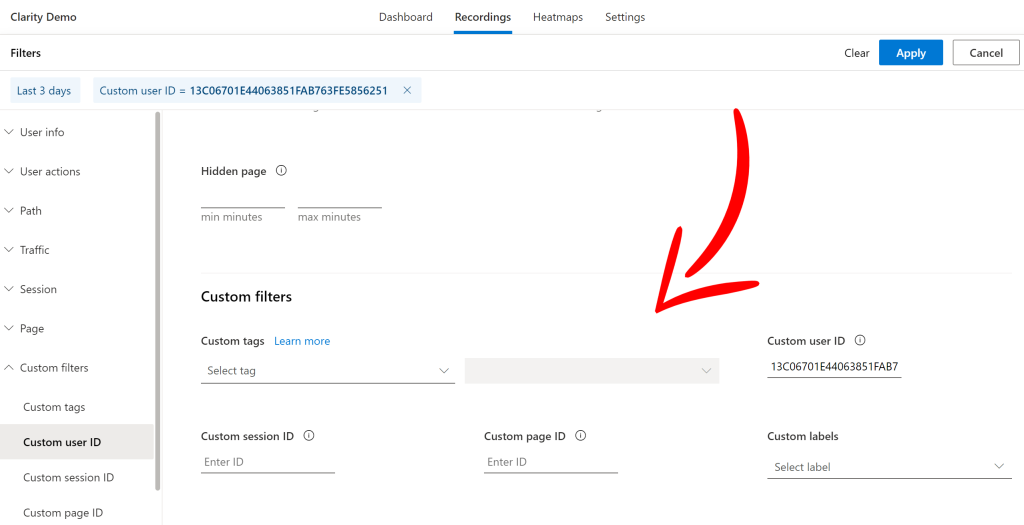
If you aren’t familiar with the user ID feature here’s how it works. A generic user ID is assigned to each visitor when they come to your site, the ID will be assigned to features like Screen Recordings. At the same time, you can also assign other custom identifiers for users, sessions, and pages if you want to track custom features on your site. As seen below, it was previously possible only to filter by the randomly assigned Clarity user ID.
After receiving your valuable feedback on expanding the custom ID feature, we categorized them into these top requests:
Making user ID clickable
A customized way to identify site attributes
Ability to filter by custom IDs
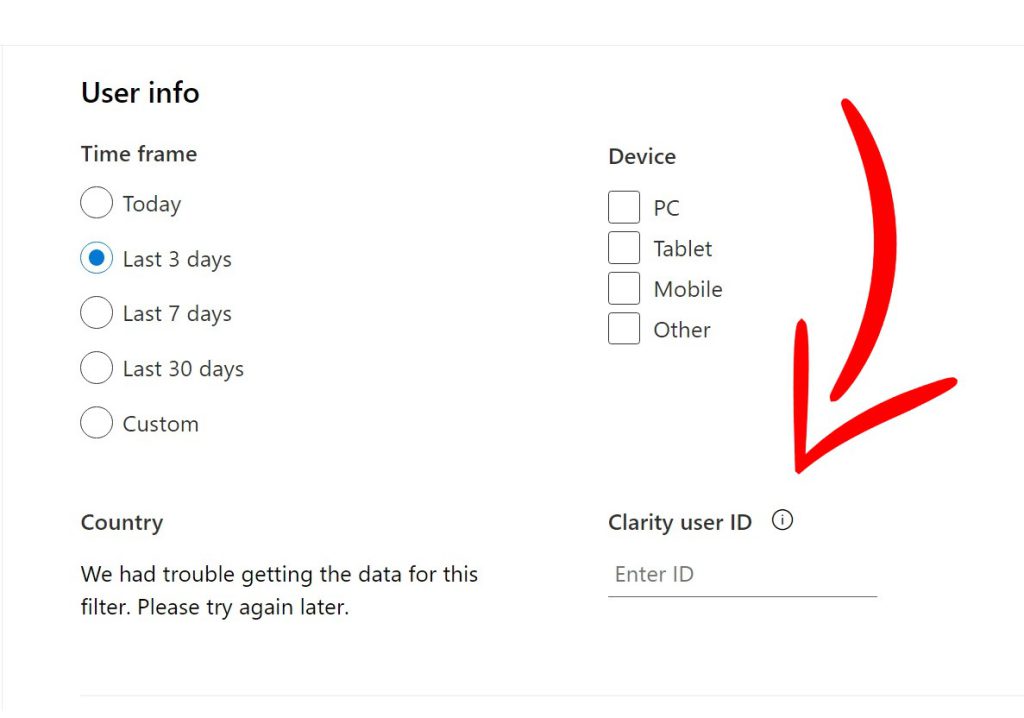
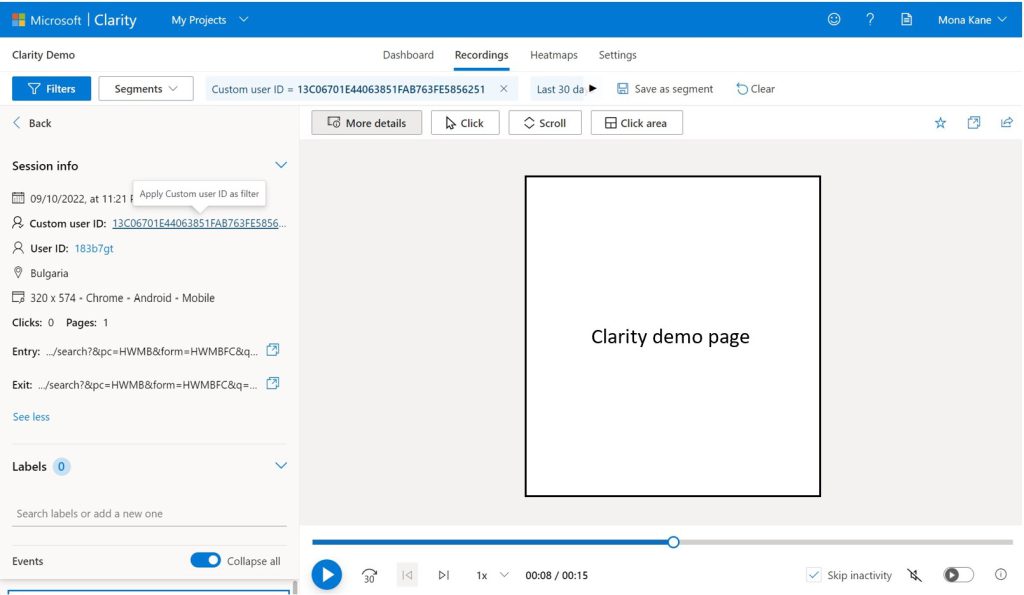
We took your feedback to heart and added new functionality for custom IDs. Take a look below to see how some of these new features will look. Both the details of custom IDs in session info and the ability to filter by custom IDs were added with this new release.
Above you can see the newly added filter fields which will allow you to filter by custom IDs.
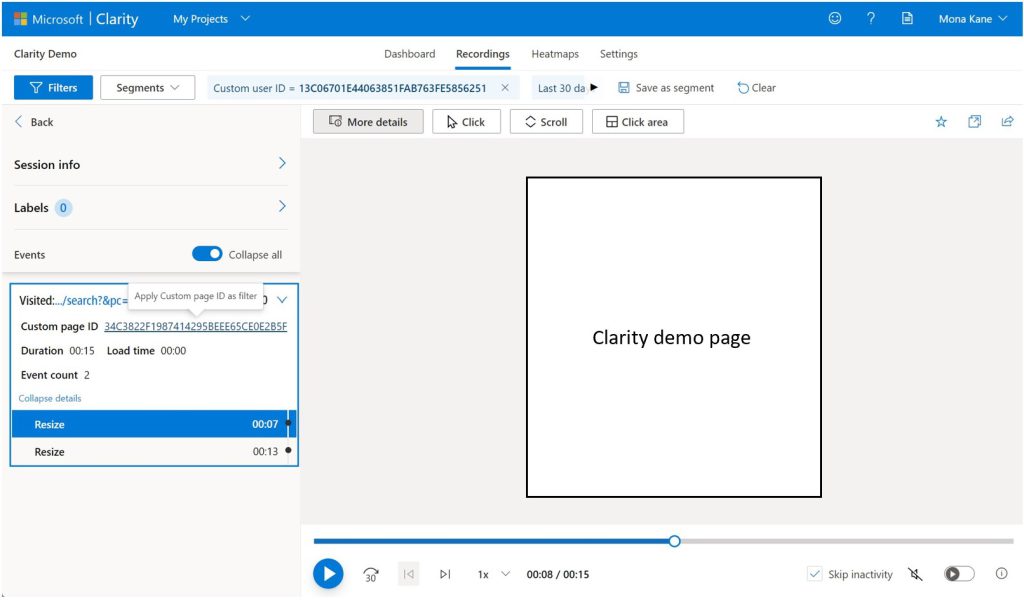
Above are how the recordings session info will look when utilizing the custom ID filters:
Custom user ID, session ID and page ID are included as part of the session info.
You can directly click on Clarity user ID or any of the custom IDs to quickly apply them as a filter and watch additional recordings for that user, session or page.
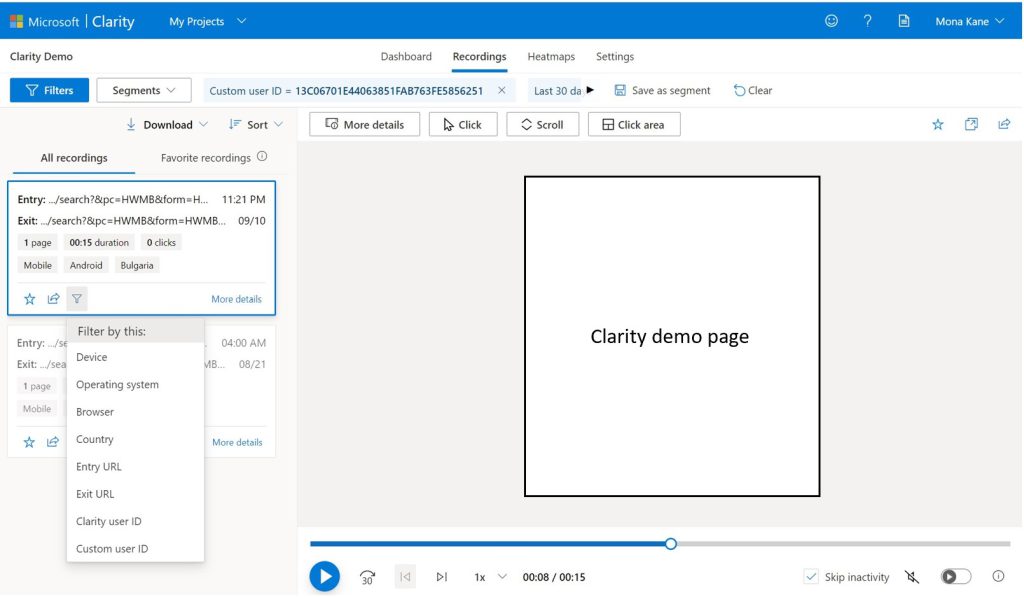
Custom ID is also added to the Filter by this list in each recording card.
We hope that these newly added features will allow you to better track and interpret customer data. As always if you have any feedback for us please reach out. You can also learn more about filters here, and to learn more about custom identifies and our API visit here.
Our team is super excited to announce the native integration of Microsoft Clarity in Softr.io!
Softr.io is a powerful software that can create apps, websites, client portals, and much more with just a few clicks.
It is the world’s largest ecosystem for building no-code apps. At Softr, they believe that everyone should have the ability to create the tools they need, without engineers or designers.
Through Softr.io you can now link data directly to Clarity! With heatmaps and session recordings, you’ll be able to visualize vital data feedback on the projects you created with Softr. Learn how to link your Soft.io data to Clarity here.
Mario Araujo, Growth Lead at Softr.io said:
“Softr.io makes app building as easy as Lego. With Microsoft Clarity integrated, they are now able to understand how their users interact with their web and mobile applications. It’s like having users sitting right next to you.”
Just another reason to join Clarity! A free-forever feature-rich user behavior tool! Get started today!
Looking for the latest and greatest behavioral analytics tool but trying to stay within a budget?
How does FREE sound?
Just make sure you get everything you need from a tool to conduct that behavioral analysis. Don’t worry we went ahead and broke down exactly what you’re getting from these free plans.
First, you need to ask yourself a few questions:
Do you foresee your business growing?
Do you require advanced filtering for segmentation?
Are you looking for a Dashboard packed with data?
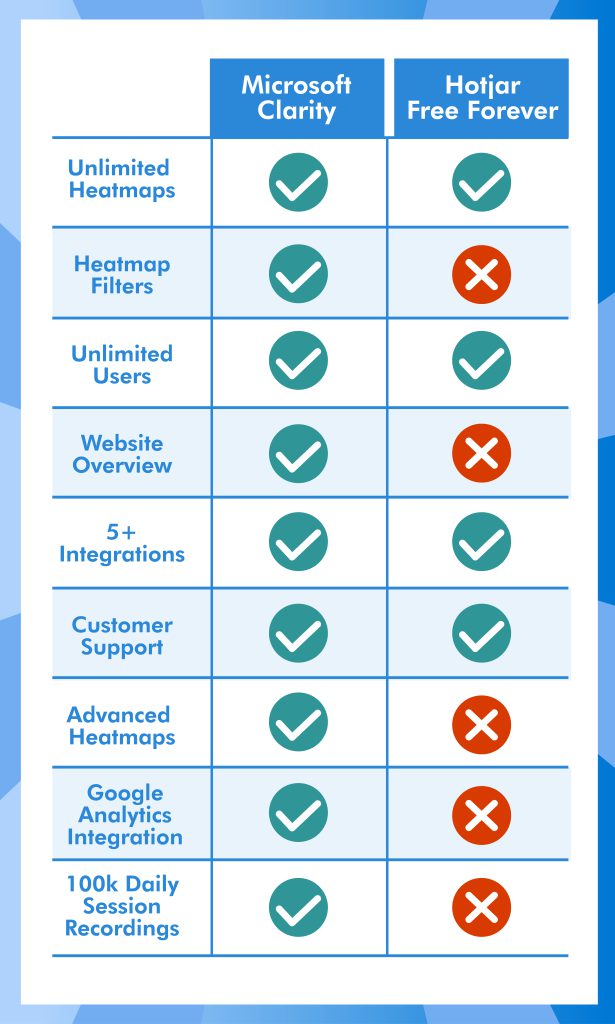
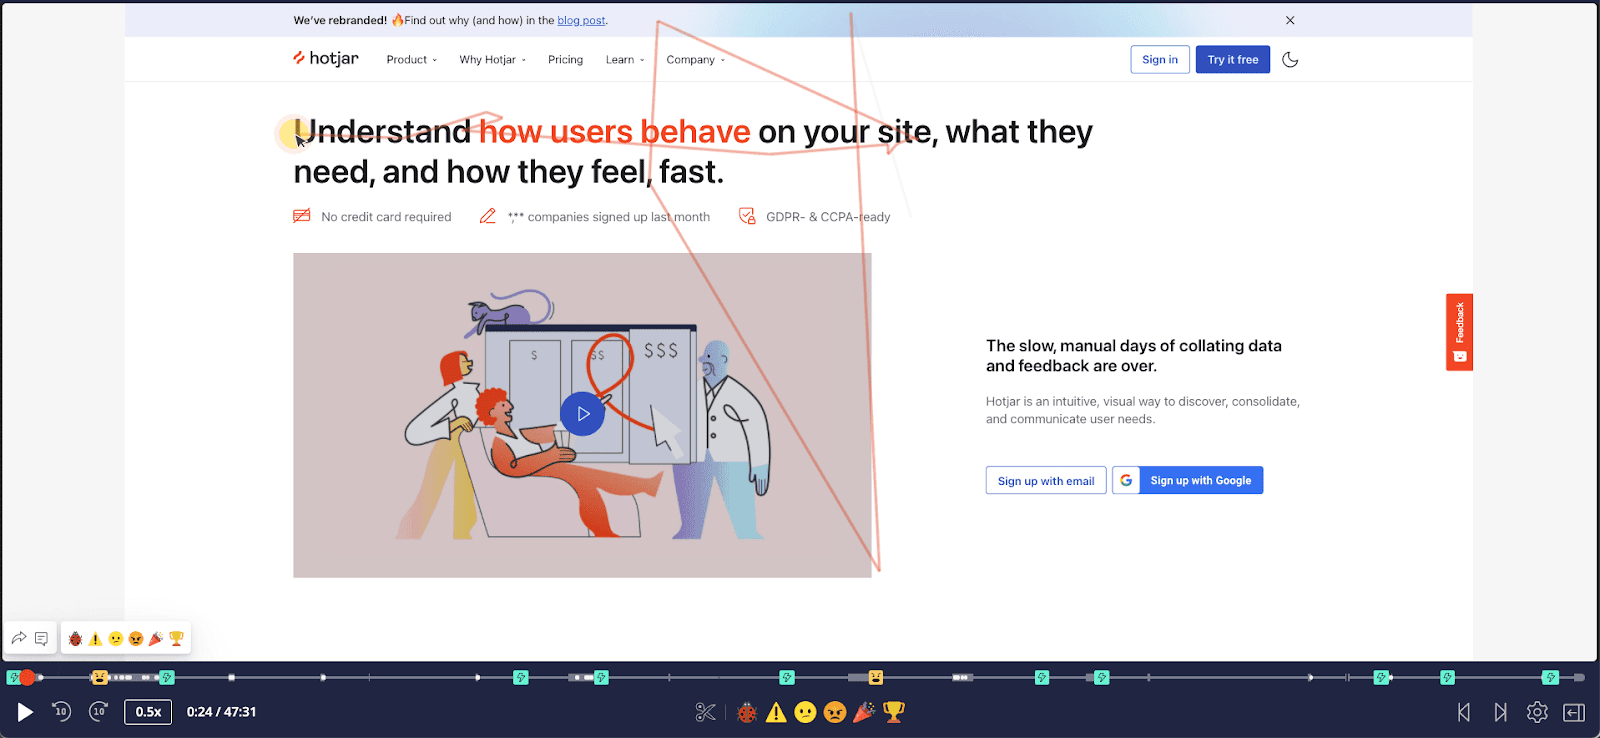
Now let’s look at Clarity, and Hotjar’s Free Forever plans have to offer!
Improve the buying experience with Clarity!
Use our insights to wow your visitors and turn them into customers! Free forever!
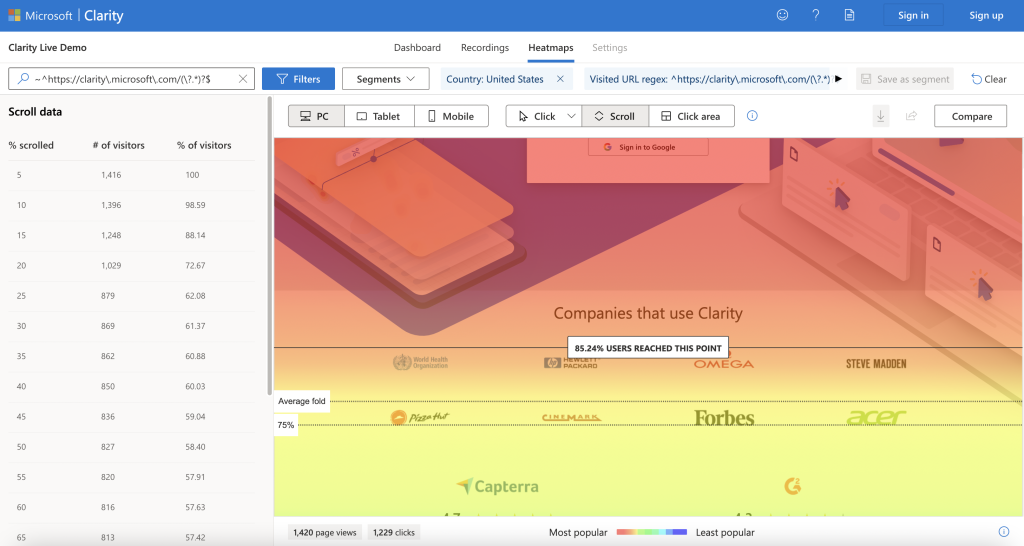
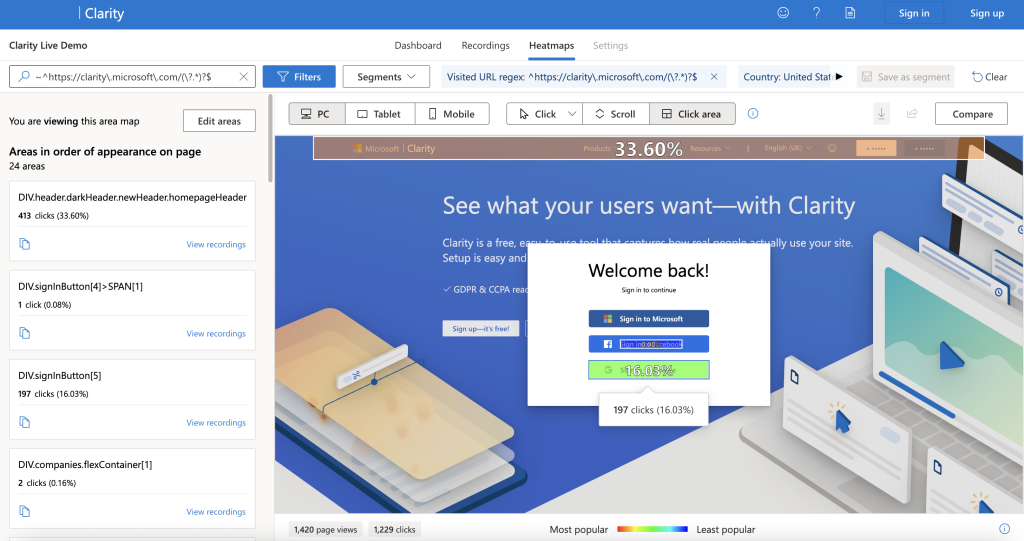
Clarity comes packed with a ton of heatmap features. You have a choice to look at your website through a click, scroll, and area heatmaps. Clarity also offers an extension for your browser to see the heatmaps on your website directly.
Click Heatmaps – A visual thermodynamic map that illustrates where the users are clicking on your website.
Scroll Heatmaps – shows the percentage of users that scrolled to a certain distance on your website. This is often used to prioritize where the call-to-action buttons or other important elements should be placed.
Area Heatmaps – Show the total number of clicks within your chosen area. This provides a clear aggregated look into the engagement with given website elements.
Advanced Filtering – Need to nail down a specific group of users? Microsoft Clarity offers many filtering options to get exactly what you need from your data.
Session Recordings
Sometimes we need to go further than the numbers when it comes to solving a problem or coming up with an idea. With session recordings, you can see exactly what your users are doing on your website. Watch them as they navigate through your website, and easily share the high-def recording with your team or outside investors.
Insights
With Clarity, you’ll be able to get insights into some stuff you probably wouldn’t even think of, but don’t worry we’ve got your back and have the solution for you!
You’ll be able to see when users run into issues such as rage clicks, dead clicks, quick backs, and more. All which can be filtered in session recording to see exactly what problem your user encountered. Say hello to website optimization!
Unlimited Users
We are all about collaborative work at Microsoft, so invite as many people as you want onto any Clarity project you own.
Google Analytics Integration
The dream team is here! That’s right, Microsoft Clarity working side-by-side with Google Analytics to bring you the best of both worlds! Explore your segmented audiences, view Google Analytics data in Clarity and visa-a-versa, and improve your conversion goals and marketing funnel.
Segmented Audiences – the key to unlocking the full potential of any digital strategy is being able to segment your user base into audiences. Clarity and Google Analytics together make this a much easier process.
Google Analytics in Clarity – Enjoy your Google Analytics right inside your Clarity platform. No more switching back and forth between platforms.
Clarity in Google Analytics – Need to get some work done inside of Google Analytics? No worries, we thought of that too! Enjoy Microsoft Clarity right inside your GA dashboard.
Improve Conversion Goals – with the Google Analytics integration; you can improve your conversion goals by seeing video recordings of each step of the funnel, which allows seeing where any friction points may appear.
Customer Support
There are 2 types of customer support that Clarity offers. One is the feedback tool on the projects page, and another is our support alias (msclarity@microsoft.com), where customers can directly reach out to our support team. It’s on our product roadmap to improve the customer support experience, stay tuned!
What Features Come with Hotjar’s Free Forever Plan
Heatmaps
Similar to Clarity, Hotjar has a robust inventory of heatmaps available to its users. You’ll even find an extra one called move maps that Microsoft Clarity no longer offers. Unlike Clarity, the heatmaps don’t allow for filtering on the free forever plan. This will make it difficult to find specific data points you’re looking for with ease.
Sessions Recording
Hotjar comes with high-def screen replays that offer custom highlights you can share with your colleagues. They also have an out-of-the-box integration with Slack to make sharing seamless.
Unfortunately, if you already have a decent amount of website traffic or plan to have more, you’ll hit a 35-a-day sessions recording limit needing to be upgraded to the paid plan.
Unlimited Users
Hotjar is big on collaboration, and they make sure this is possible with unlimited users. This is even true for their Free Forever Plan as well.
Customer Support
At Hotjar, they have a friendly bunch of customer support specialists, always available to offer you personalized support. They respond to every email ticket within 48 hours (sometimes less!), giving you peace of mind when using their tool.
At the start, we asked three questions about your needs. Now that we took a look into what both of these tools offer, let’s focus on you!
Do you foresee your business Growing?
How often have you run into monthly thresholds and mandatory upgrades as your business grows?
If you’re tired of dealing with this issue, then Clarity is just what you’re looking for. No limits. No fees. No restrictions. You get everything you need for your behavioral analytics completely free. At Clarity, we encourage you to grow and be successful. We would take it a step further and say we would be honored to do a case study on how Clarity helped your business grow.
Do you require advanced filtering for segmentation?
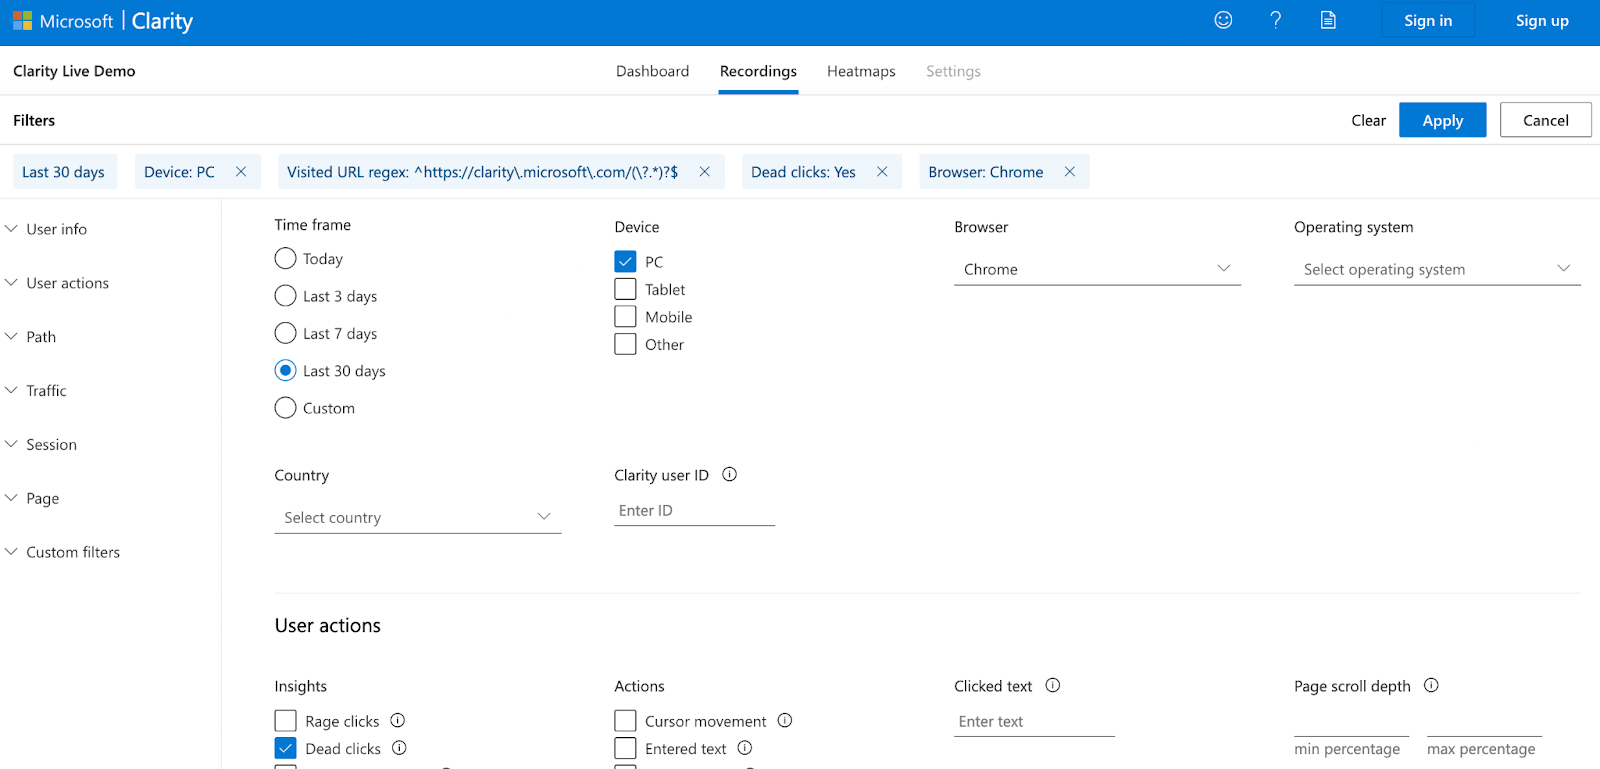
Data has become an essential aspect of every business model. Advanced filtering allows you to create segments and explore them deeply and efficiently within Microsoft Clarity. For example, if you wanted to segment the past 30 days of PC users, using chrome, and that encountered a dead click you can. Save it and run that query whenever.
Are you looking for a Dashboard packed with data?
Everything is starting to come together on your website, and we know where to view it, the Clarity Dashboard. The team created a place where key events are neatly organized and easily downloadable to share with team members.
Is Hotjar’s Free Forever Plan Right for you?
If you like that slack integration to collaborate with your team, Hotjar might be the right pick for you (maybe we will be supporting this soon too…hint hint 🙂). The downside is the daily recording limits and the inability to filter your heatmaps.
Is Clarity right for you?
For free behavioral analytic tools, it doesn’t get better than Microsoft Clarity. Clarity offers everything that most top-tier paid plans that competitors offer, for absolutely no cost.
Ask yourself one last question, do you want to get approval to implement your fancy new behavioral analytics tool on your website, then come back a few weeks later asking your boss for money to upgrade your plan?
We don’t think so either!
Sleep with ease knowing you have everything you need from a behavioral analytics tool such as heatmaps, session recordings, advanced filtering, and much more at no cost. Get clarity—with Clarity.
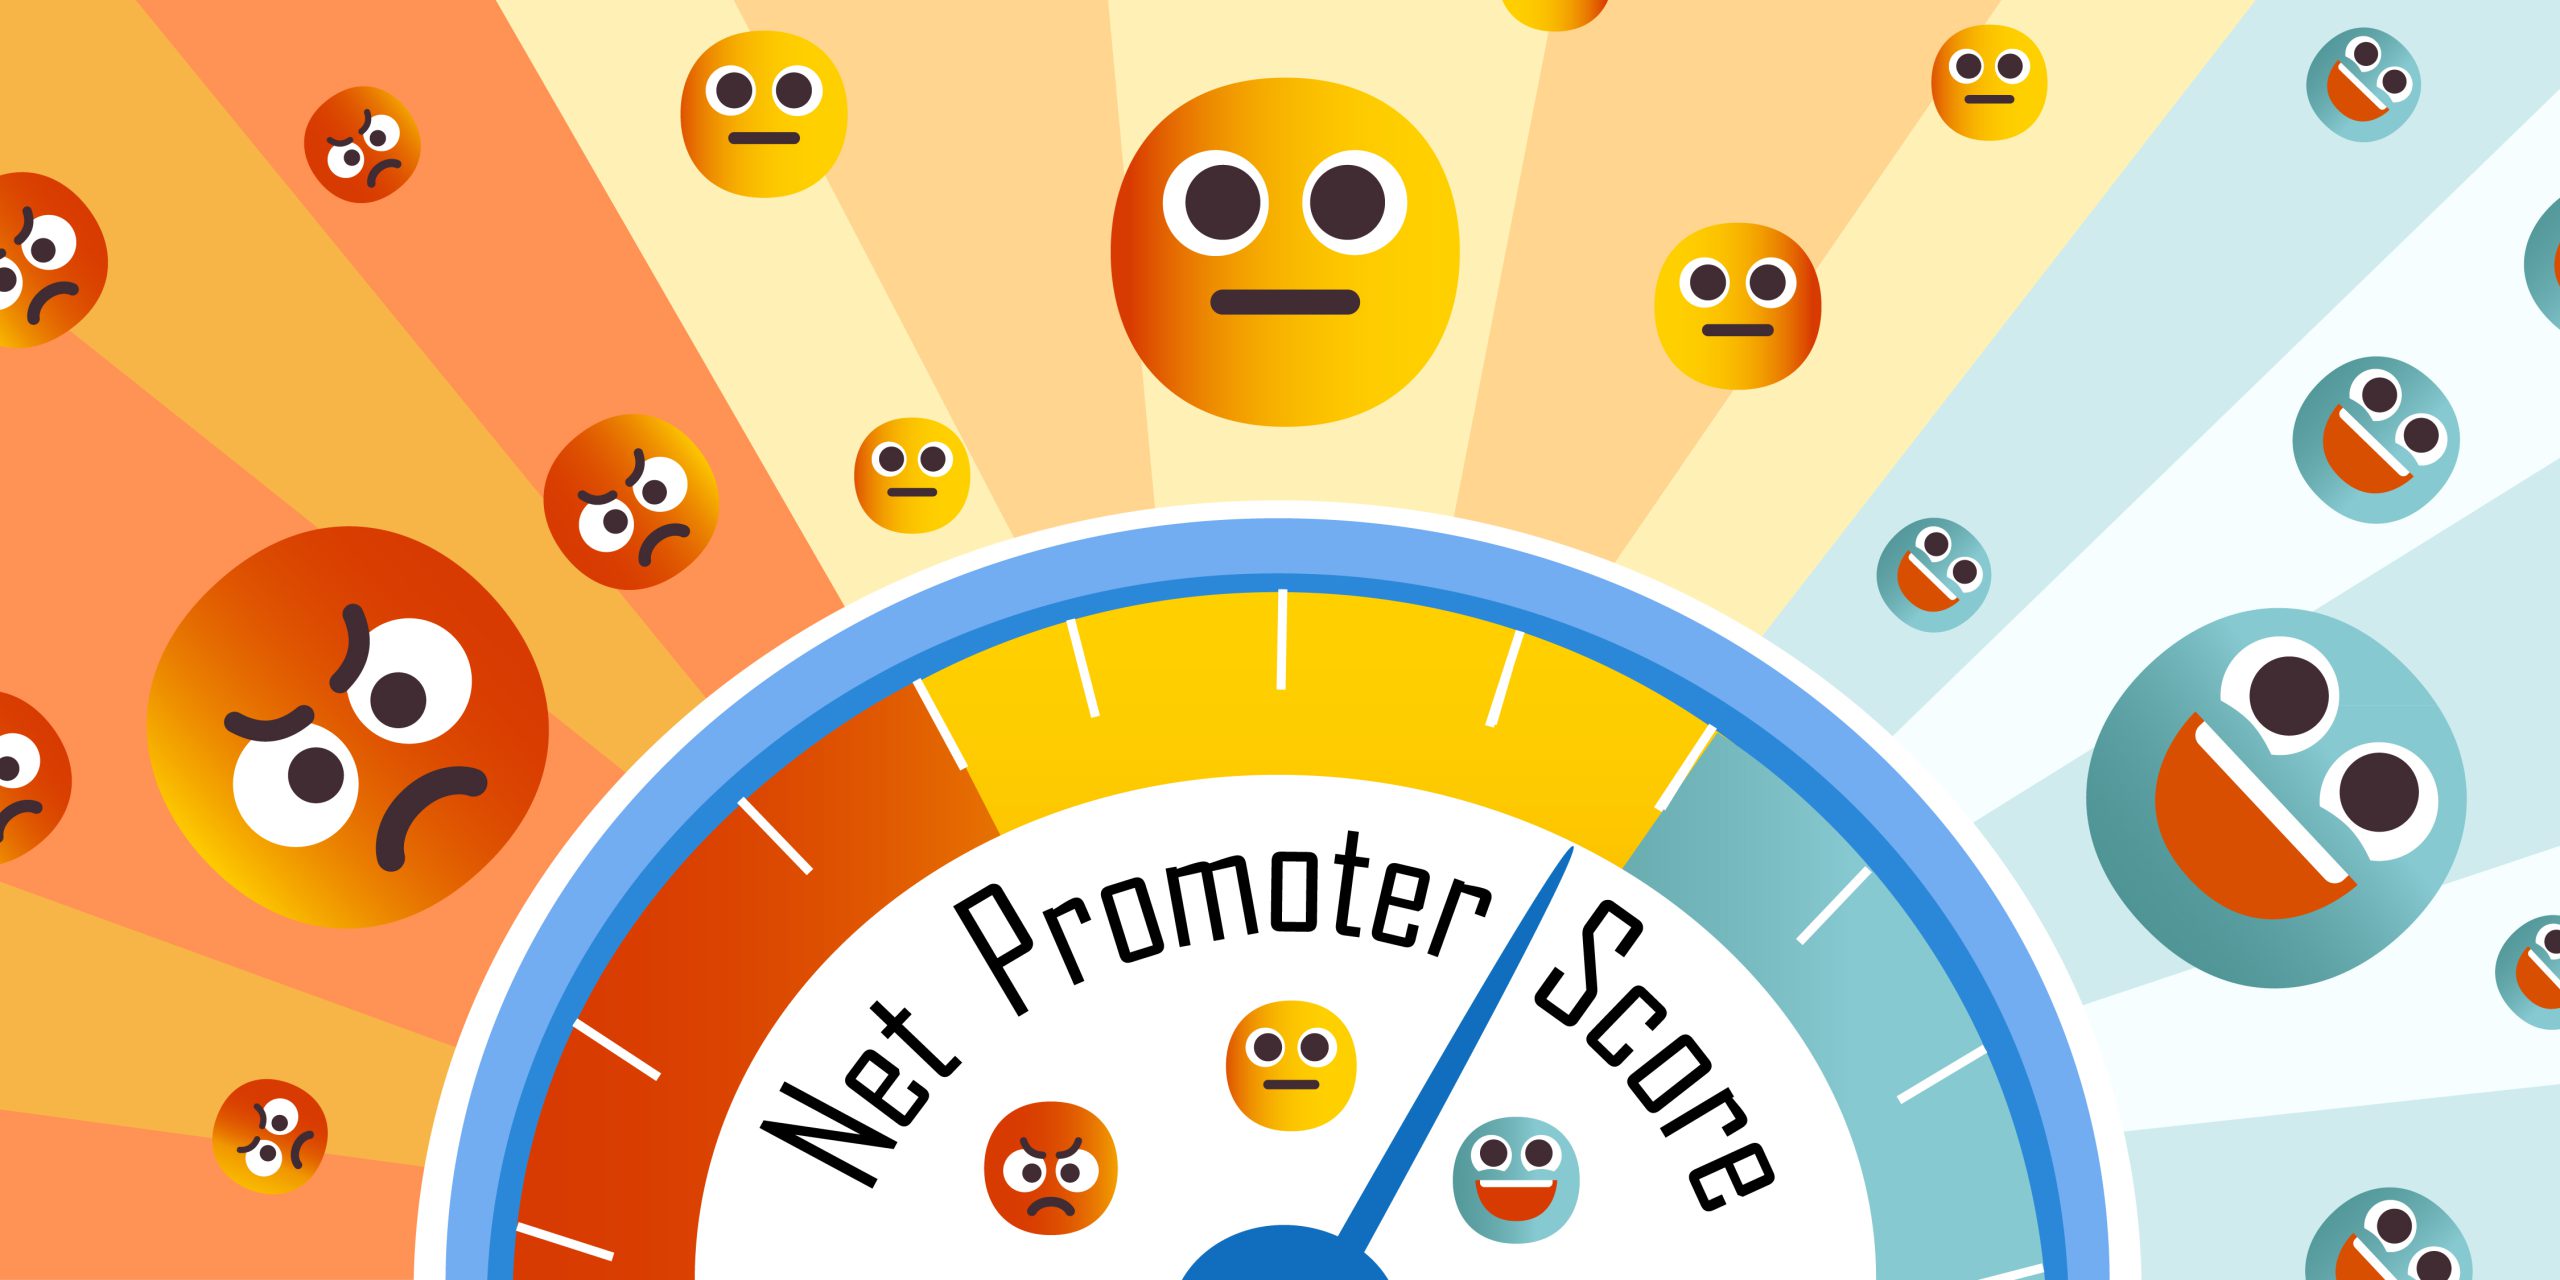
Curious about how your brand is perceived online? Trying to understand opportunities to improve? Let us share with you about NPS and how Clarity can help you optimize it.
Net Promoter Score (NPS) is a metric that tells how likely your customers are to recommend your product or service. It is based on their score and placed into three categories — promoters (9-10), passives (7-8), and detractors (6 or less). With NPS, you can see who is talking about your brand online and learn which areas need improvement. By using Clarity, you can identify high-priority on-page issues that can improve the NPS score for your company.
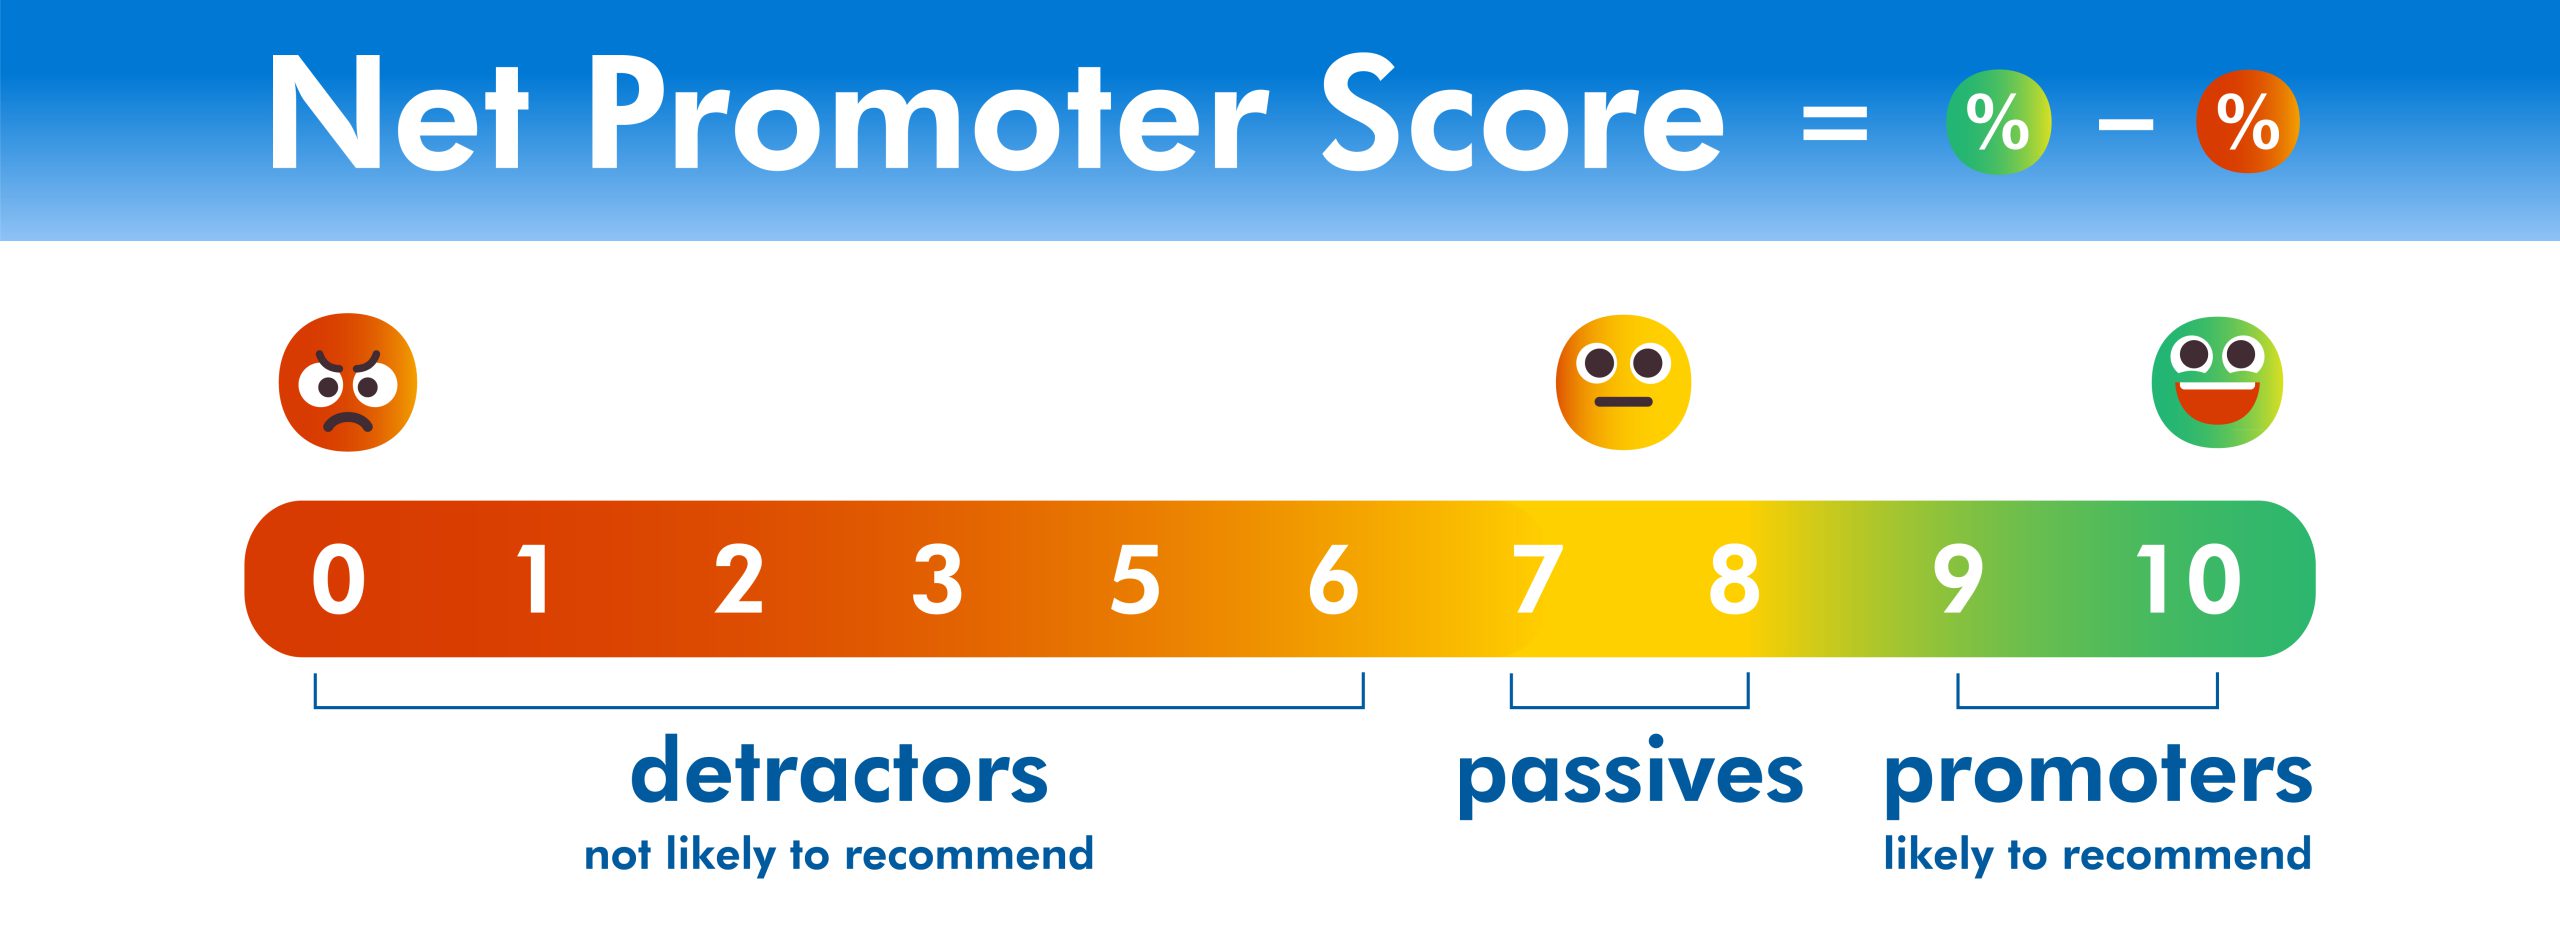
Net Promoter Score Scale
Before calculating your NPS score, you must collect customer feedback using a 0-10 scale. As shown above, anything below 6 is a detractor, 7-8 a passive, and a 9 or 10 is a promoter. These will be the three variables that you will use to measure customers when calculating the NPS score.
Promoters (9-10) are your cream of the crop users. They are most likely to leave positive reviews, refer to their friend or colleague, and be loyal customers that help you surpass competitors in your industry.
Passives (7-8) are not included in the NPS calculation but are still crucial to the company. These people can very easily be tilted in either direction and with a little nurturing, these customers can become promoters.
Detractors (0-6) will likely be the individuals leaving negative reviews after their unsatisfied one-time purchase. Detractors shouldn’t be dreaded but embraced because they offer valuable feedback on where you need to improve your company or product. Take their words seriously, and you’ll improve customer satisfaction.
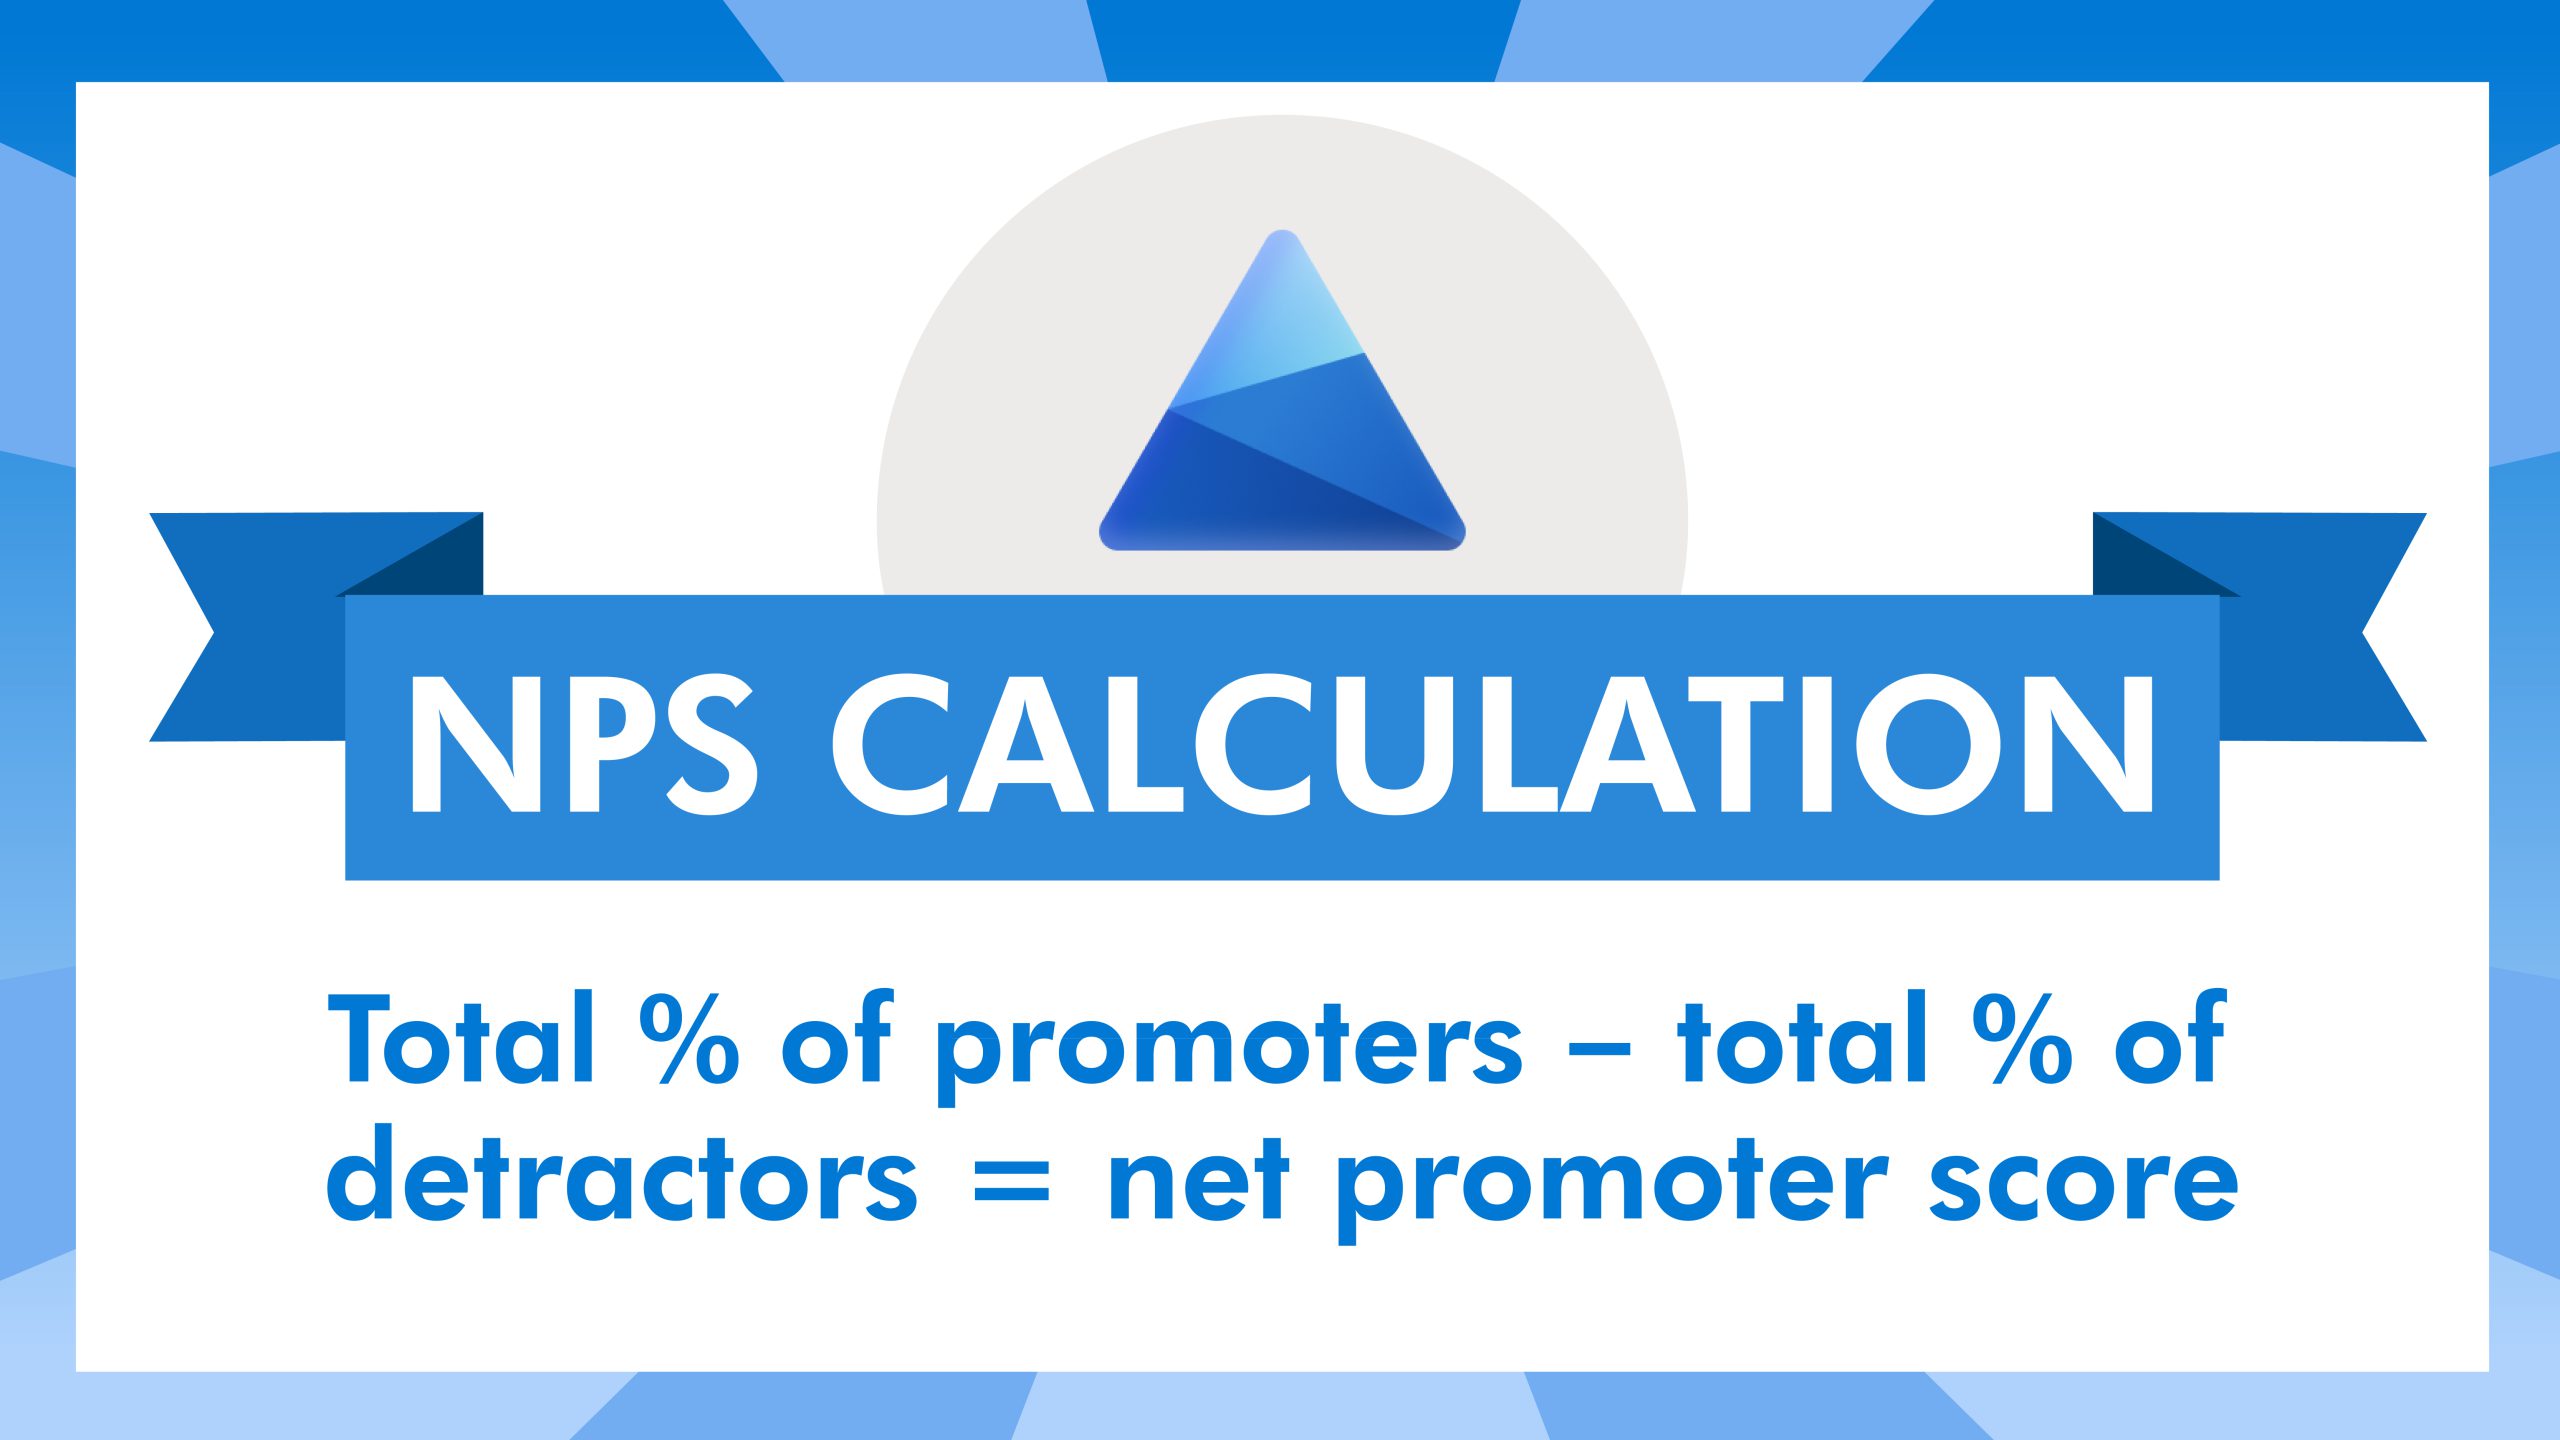
How to Calculate NPS
NPS is a simple formula calculated by subtracting the percentage of promoters by the percentage of detractors. You will ignore the passives (7-8) group since they will likely shift in either direction.
Net Promoter Score Calculation
What is a good or bad NPS score?
You’ve calculated your NPS score and now you want to know if your NPS score is good or bad.
A “good score” is technically anything above 0 as there would be more promoters than detractors. On the other hand, anything less than 0 would be considered a “bad” score, but we have to be mindful of NPS industry averages. An NPS score varies by industry, so you’ll need to search specifically in your industry to get an accurate score.
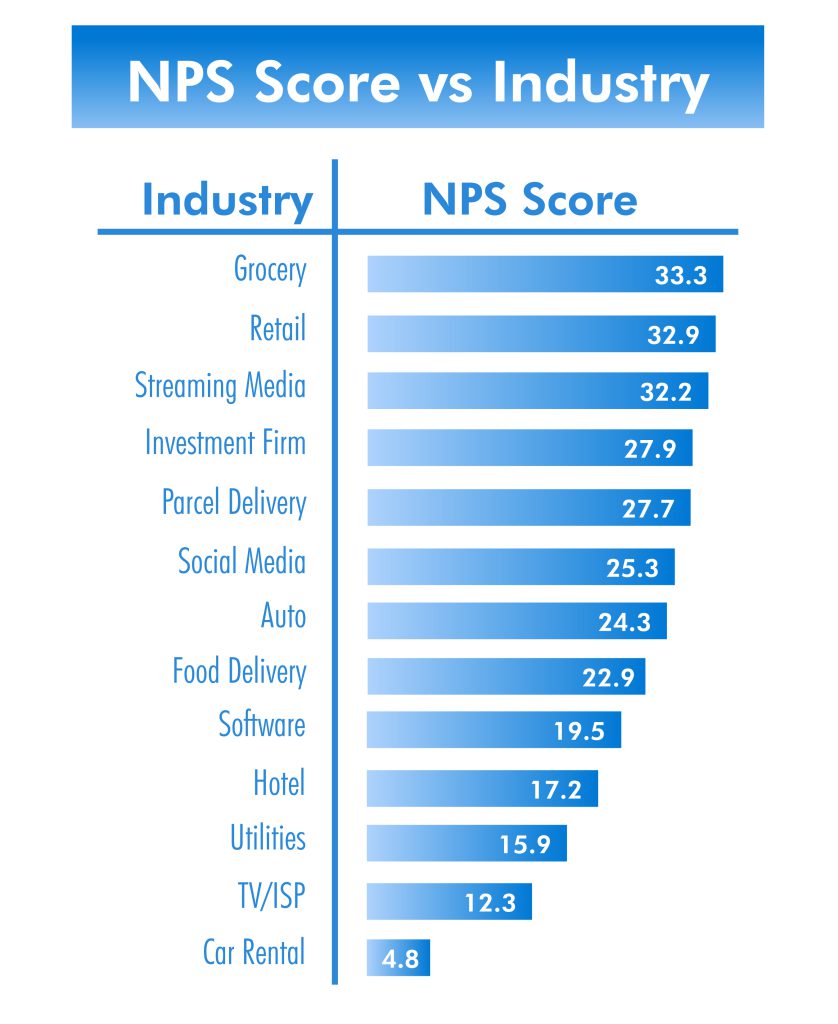
For example, Airline A has an NPS score of 3, which is technically good but compared to their competitors such as Airline B (NPS score of 41), Airline C (NPS score of 50), and Airline D (NPS score of 77), it needs improvement for that industry.
NPS INDUSTRY AVERAGES
How can Clarity Improve NPS
Clarity is used to identify critical issues with your website and help you prioritize which issues or pain points you should address first to improve your NPS score. Clarity makes it simple to understand user behavior and visualize data with our heatmaps, insights, session recordings, and seamless integration with Google Analytics.
Heatmaps – A Heatmap (or heat map) is a type of data visualization that displays aggregated information in a visually appealing way. User interaction on a website includes clicks/taps, scrolls, mouse movements, etc.
This can improve the NPS score by establishing a benchmark for recent customer experience. Use the heatmap compare feature to see the results of your A/B testing.
Helps identify content trends to see what customers resonate best with, what they click on, and what they scroll to
Allows you to allocate resources to improve low-performing content or web layouts
Clarity Insights – Track what matters to pinpoint where customers are quickly becoming frustrated on your website. Investigate and fix them before it puts a wrench in your NPS score.
Rage Clicks – See where customers repeatedly click. It might be a pain point that hurts the customer experience.
Dead Clicks – See when customers click and nothing happens. It is a good indicator that something might not work on your website.
Quick backs – View how customers click to one page and return right back to the previous page. Maybe the connected content isn’t relevant to the user flow.
JavaScript Errors – Narrow down recordings to sessions with JavaScript errors or image errors. See what the customer did prior and fix the issue.
Session recordings – You found some potential problems using heatmaps and insights, but you still aren’t sure what is going on. Don’t worry! Session recordings allow you to see what exactly happened when the customer visited your site.
This function gives you a first-row seat to how your actual customers are using your website.
The power to see from a different perspective to spark ideas, find errors, and capture areas of opportunity make this a powerful tool to boost your NPS score.
Google Analytics Integration – We know hard it can to work within all these different applications, but with our seamless Google Analytics integration you can see your metrics right inside of Clarity.
Watch recordings for automatically imported Google Analytics segments to understand user behaviors that your team cares the most about.
Improve Google Analytics goals in Clarity and obtain insights into why some users drop off to minimize the number of detractors.
With Microsoft Clarity, you will quickly be able to identify the right questions to ask to get answers. For example, are my customers upset with the company, or are they frustrated with the process of getting the product from the company? Do not let a website take away from your fantastic product, instead use Clarity to wow them with a seamless user experience.
A Clarity Conclusion
NPS is an important metric to use to see what the overall customer sentiment is with a company. You can increase your customer experience, allocate resources, and improve your NPS score with Clarity.
The more promoters you have, the better! Promoters are loyal supporters who promote the product or service on social media and share positive feedback to aid in business growth. They are also likely to purchase from you again if they were satisfied with their experience during the first purchase.
Stop guessing how to improve your customers’ experience—get clarity with Clarity.
Improve the buying experience with Clarity!
Use our insights to wow your visitors and turn them into customers! Free forever!


![Clarity vs. Hotjar’s Free Forever Plan [2022]](https://clarity-blog-staging.blog.p.azurewebsites.net/wp-content/uploads/2022/09/MicrosoftTeams-image-2-scaled.jpg)