Better Together: Clarity + Firebase

Better Together: Clarity + Firebase

Say goodbye to guesswork and hello to a new level of insight with Clarity and Firebase! 

Now, you can gain more understanding of your customers, not only by knowing what happened, but also by knowing why it happened! By linking Clarity session recordings with Firebase, you can now access your session and user URLs directly on each of your Firebase events/screens, making it a breeze to watch video recordings and analyze the entire user experience.  

Starting 2.1.0, We have introduced the getCurrentsessionURL API, that allows you to send and connect analytical events with Clarity. This URL is versatile and can be used with popular analytics tools like Firebase, Mixpanel, and others. In this blog, we will describe the steps needed to link Clarity’s session recordings with Firebase Analytics and Crashlytics SDKs. 

Steps: 

Note: You need to have a Firebase Google Analytics account and a Clarity account. If you don’t have one, Create one here

In Firebase

  1. On your Firebase project Dashboard, under the Analytics section click on Custom Definitions and then go to “Create custom dimensions”. 
  1. Give your dimension a descriptive name and parameter.  
  1. Add an “event parameter” to this dimension in. This parameter will contain the Clarity session recording URL.

In your app: 

Note: You should already have a Clarity project with Clarity’s Mobile SDK successfully integrated. If you don’t, Get started here

  1. Navigate to the section where you initialize Clarity. (ex: MainActivity). 
  1. Add callback function “Clarity.SetonNewSessionStartedCallback. This function will be triggered whenever a new clarity session starts. 
  1. Get the session URL, using the clarity.getCurrentSessionURL API to get the current sessions URL that is to be sent to Firebase Analytics. 
  1. Ensure that the Event name that you use in Clarity and the Event Parameter are the same that you’ve created on Firebase. 

To view Clarity’s sessions in Firebase: 

  1. Navigate to your Analytics Dashboard in Firebase. 
  1. View/add custom parameters to your events. For events, click on the session_started event. 
  1. Navigate down to the custom parameters card. Double-click on clarity_links to highlight the value, then copy it in a new browser window. 
  2. You should now see the session recording that contains session_started event in Clarity’s dashboard. 

For pages/screens, you can also see the same information by adding a custom parameter to the page/screen. 

Events in Firebase can take up to 24 hours to appear in the dashboard, but if you want to make sure that you are logging the events properly, run the following command, then check the Firebase debug view. 

adb shell setprop debug.firebase.analytics.app "yourpackagename" 

Firebase Crashlytics 

If you are using crashyltics SDK to collect your app crashes, you can just follow the same steps by calling the clarity.SetInNewSessionStartedCallback function where Clarity is initialized.  

You can view Clarity sessions’ and users’ link in the Keys section of your crashed session within Firebase console. 

If a crash occurs in your mobile app, you can gain valuable insights by analyzing the session and video recording where the crash took place. This will provide you with more context on the crash and help you understand how it affected the user journey. Additionally, you can analyze user behavior after experiencing a crash by checking the user sessions in Clarity’s user profile. By doing so, you can identify any patterns or trends that may be contributing to crashes and take steps to improve your app’s performance and user experience. 

By combining the detailed session recordings of Clarity with the robust analytics of Firebase, developers and marketers now have a powerful tool at their disposal.

Say Goodbye to Manual Tracking: Introducing Clarity’s automatic Smart Events

Say Goodbye to Manual Tracking: Introducing Clarity’s automatic Smart Events

Ever struggle to decipher your website analytics, unsure what data truly matters? Spending too much time adding code just to track a single user action? Clarity’s smart events are here to streamline your website’s user event tracking. Imagine this: your dashboard automatically tracks key user actions, like form submissions or account creations, without you lifting a finger. No coding, no setup – just clear, fast insights at your fingertips.

What are Clarity smart events?

Clarity detects key user actions on your website, creating smart events specific to it – all without you needing to write additional code!

For example, if you own an e-commerce website, Clarity can detect “Add to Cart”, “Start Checkout” and “Purchase” smart events for your site with no setup required. Or if you have ten different “Contact Us” buttons scattered across your website, Clarity can automatically compile them into a single “Contact Us” smart event – like the image below.

Using Clarity smart events

By labeling your sessions with the specific user events that occurred, Clarity helps you zoom quickly into what matters. Understand how many visitors are taking a certain action, watch recordings where those happen, and filter to see where they’re coming from.

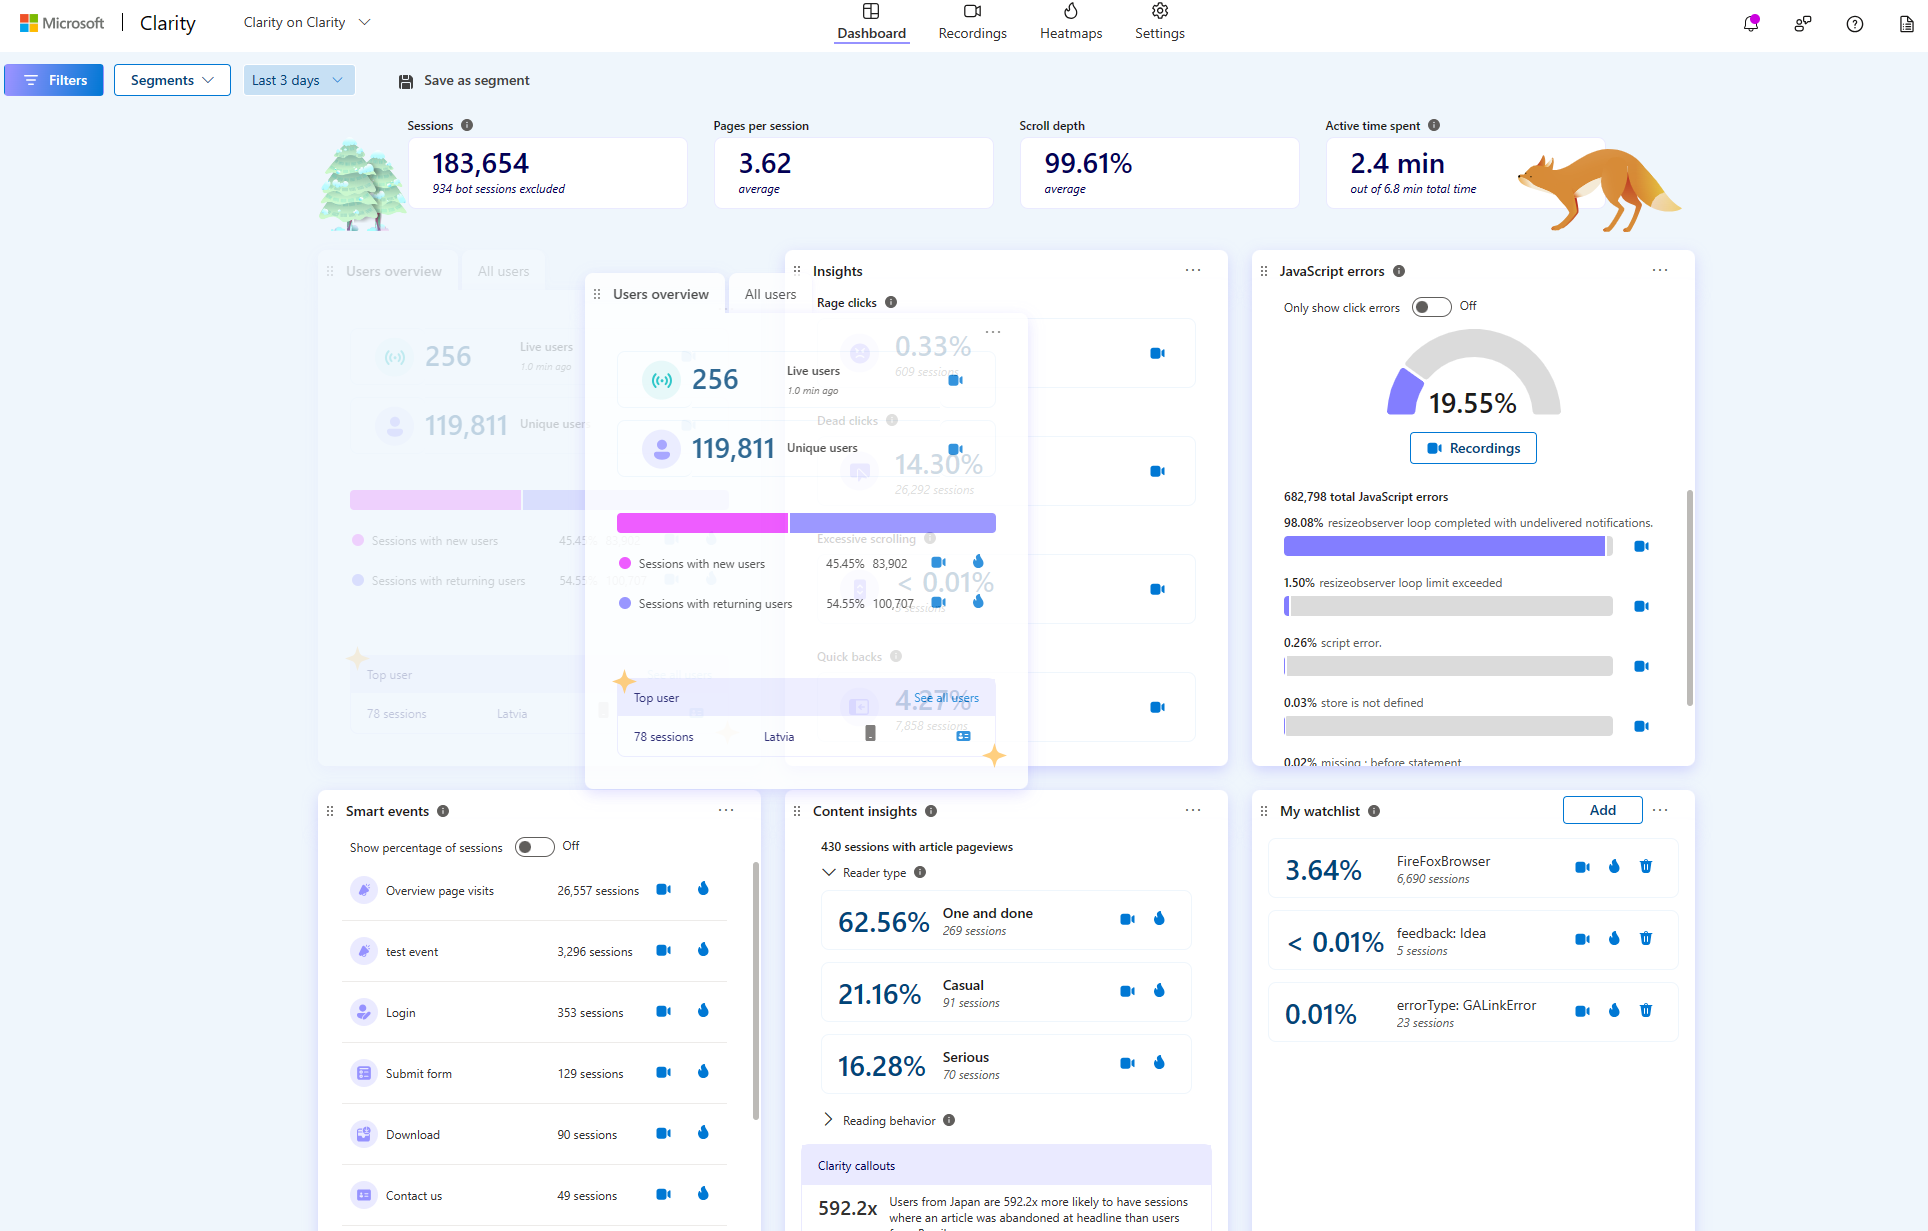
Dashboard: View the smart events module in the Clarity dashboard. Your active smart events will show up here, along with links to watch session recordings and view heatmaps where these events happen.

Filters: Zoom into the sessions where a smart event happens, by filtering for it. See what campaigns bring in the most visitors who create accounts, or view the percentage of visitors who submit forms that are returning users.

Session Recordings: Watch user sessions where a specific smart event occurred. You’ll notice the event is annotated for you in the left-hand Events module or the recording timeline at the bottom of the recording.

Customizing smart events

We know that everyone’s journey requires different paths, so we’ve also made it easy to edit smart events to your liking—completely without code of course!

Create smart events: Clarity auto-populates for you all detected buttons, API events, auto-events and URL visits. Select the ones you’re interested in tracking and then name your event. It’s that simple!

Edit smart events: It’s also just as easy to add or remove events. Simply navigate to the event and select “Edit event”. It’ll pop out the same code-free catalog above for you to select from. 

Give it a try!

Microsoft Clarity’s Smart events are here to make your analytics easier than ever: 

1. Automatic event tracking: We’ve eliminated manual setup! Just log in and get straight to the session recordings that matter. 

2. Code-free implementation: Customize your events as needed in seconds without any code. We’ve already surfaced up all buttons and URL visits, so that you don’t need to.

3. Actionable insights: Pair your smart events with session recordings and our Copilot insights to rapidly identify conversion opportunities and user experience opportunities. 

Get started now by creating an account or viewing our documentation here!

Enhancing Your Wix Website with Microsoft Clarity

Enhancing Your Wix Website with Microsoft Clarity

A website’s success depends on having a solid understanding of user behavior. As a leading behavioral analytics provider, we offer crucial insights into user behavior on websites. The new Clarity integration for Wix is a game-changer for websites owners, providing a thorough understanding of visitor interactions and enabling data-driven enhancements.

The Power of Integration

Wix, known for its user-friendly website building capabilities, can be transformed into an even more powerful tool when combined with Clarity’s detailed behavioral analytics. This integration allows website owners to track user behavior, identify pain points, and enhance the overall user experience.

Key Features & Metrics Microsoft Clarity Offers

To fully leverage the benefits of the Clarity-Wix integration, it’s important to understand the value Clarity provides:

  • Heatmaps: Visualize user engagement and scrolling behavior on your Wix pages, offering insights into what captures visitor attention.
  • Session Recordings: Go beyond numbers and observe real user interactions with your site, identifying what works and what needs improvement.
  • Copilot in Clarity: Let the artificial intelligence Copilot assist your data analysis and decision-making process to streamline your workflow. You can now use session takeaways and heatmap insights for your session recordings and heatmaps to analyze your data efficiently with the help of AI.
  • Rage Clicks: Detect user frustration through repeated clicks on an element, signaling areas that may require redesign or clarification.
  • Dead Clicks: Identify when users click on non-responsive elements, highlighting potential navigational issues.
  • JavaScript Errors: Uncover technical problems that could be hindering user experience.
  • Excessive Scrolling: Understand if users struggle to find what they need, indicating potential layout or content issues.
  • Quick Backs: Notice when users quickly return to a previous page, which may suggest dissatisfaction with the content or layout.
  • Content Insights: For blog specific sites, Clarity groups your readers into one-and-done, casual, and serious readers. Allowing you to see what pieces of content resonate with your audience the most.

Each of these metrics offers valuable insights, helping Wix website owners refine their user experience.

Benefits of the Clarity and Wix Integration

Integrating Clarity with your Wix site brings several advantages:

  • Embedded View: The Clarity experience is embedded within WIX, enabling users to access features directly on the WIX platform. This includes signing into Clarity, creating or linking projects, and viewing data, all seamlessly integrated within WIX (pictured below).
  • Enhanced User Experience: Gain a clear understanding of how visitors interact with your site, allowing for targeted improvements.
  • Data-Driven Decisions: Make informed changes to your website based on actual user behavior, rather than guesswork.
  • Improved Website Performance: Identify and fix technical issues quickly, ensuring a smooth experience for your visitors.
  • Increased Engagement and Conversion: Use insights to optimize your site for better engagement and higher conversion rates.

Setting Up the Integration

Integrating Microsoft Clarity with your Wix website is straightforward:

  1. Login to your WIX account
  2. Search for Microsoft Clarity from the app market here
  3. Add Clarity to your website 
  4. Users will sign in to Clarity from WIX and will create or connect an existing Clarity project
  5. Users will access the Clarity project from WIX

Transform Your Wix Website with Clarity

Integrating Microsoft Clarity with your Wix website will provide actionable insights that can transform your site. By understanding and responding to user behavior, you can create a more engaging, effective, and user-friendly website. Start with this integration today and see the difference it makes in your website’s performance and user experience.

The Clarity Dashboard is Now Customizable! 

The Clarity Dashboard is Now Customizable! 

We are excited to share the latest Microsoft Clarity update with you all. We’ve been listening to your feedback and are excited to introduce customizable dashboards—a tool that will personalize the way you work with your data.  

Here at Clarity, we are all about doing what is best for our users. That’s why we believe you should have the flexibility to customize your dashboard to suit your needs.  

Drag and Drop

Do you wish you could change the default dashboard layout?  You now have the option to drag and drop the cards on your dashboard. This means you can quickly view the information that matters most by moving your most critical cards to the top of your dashboard.  

Hiding Cards

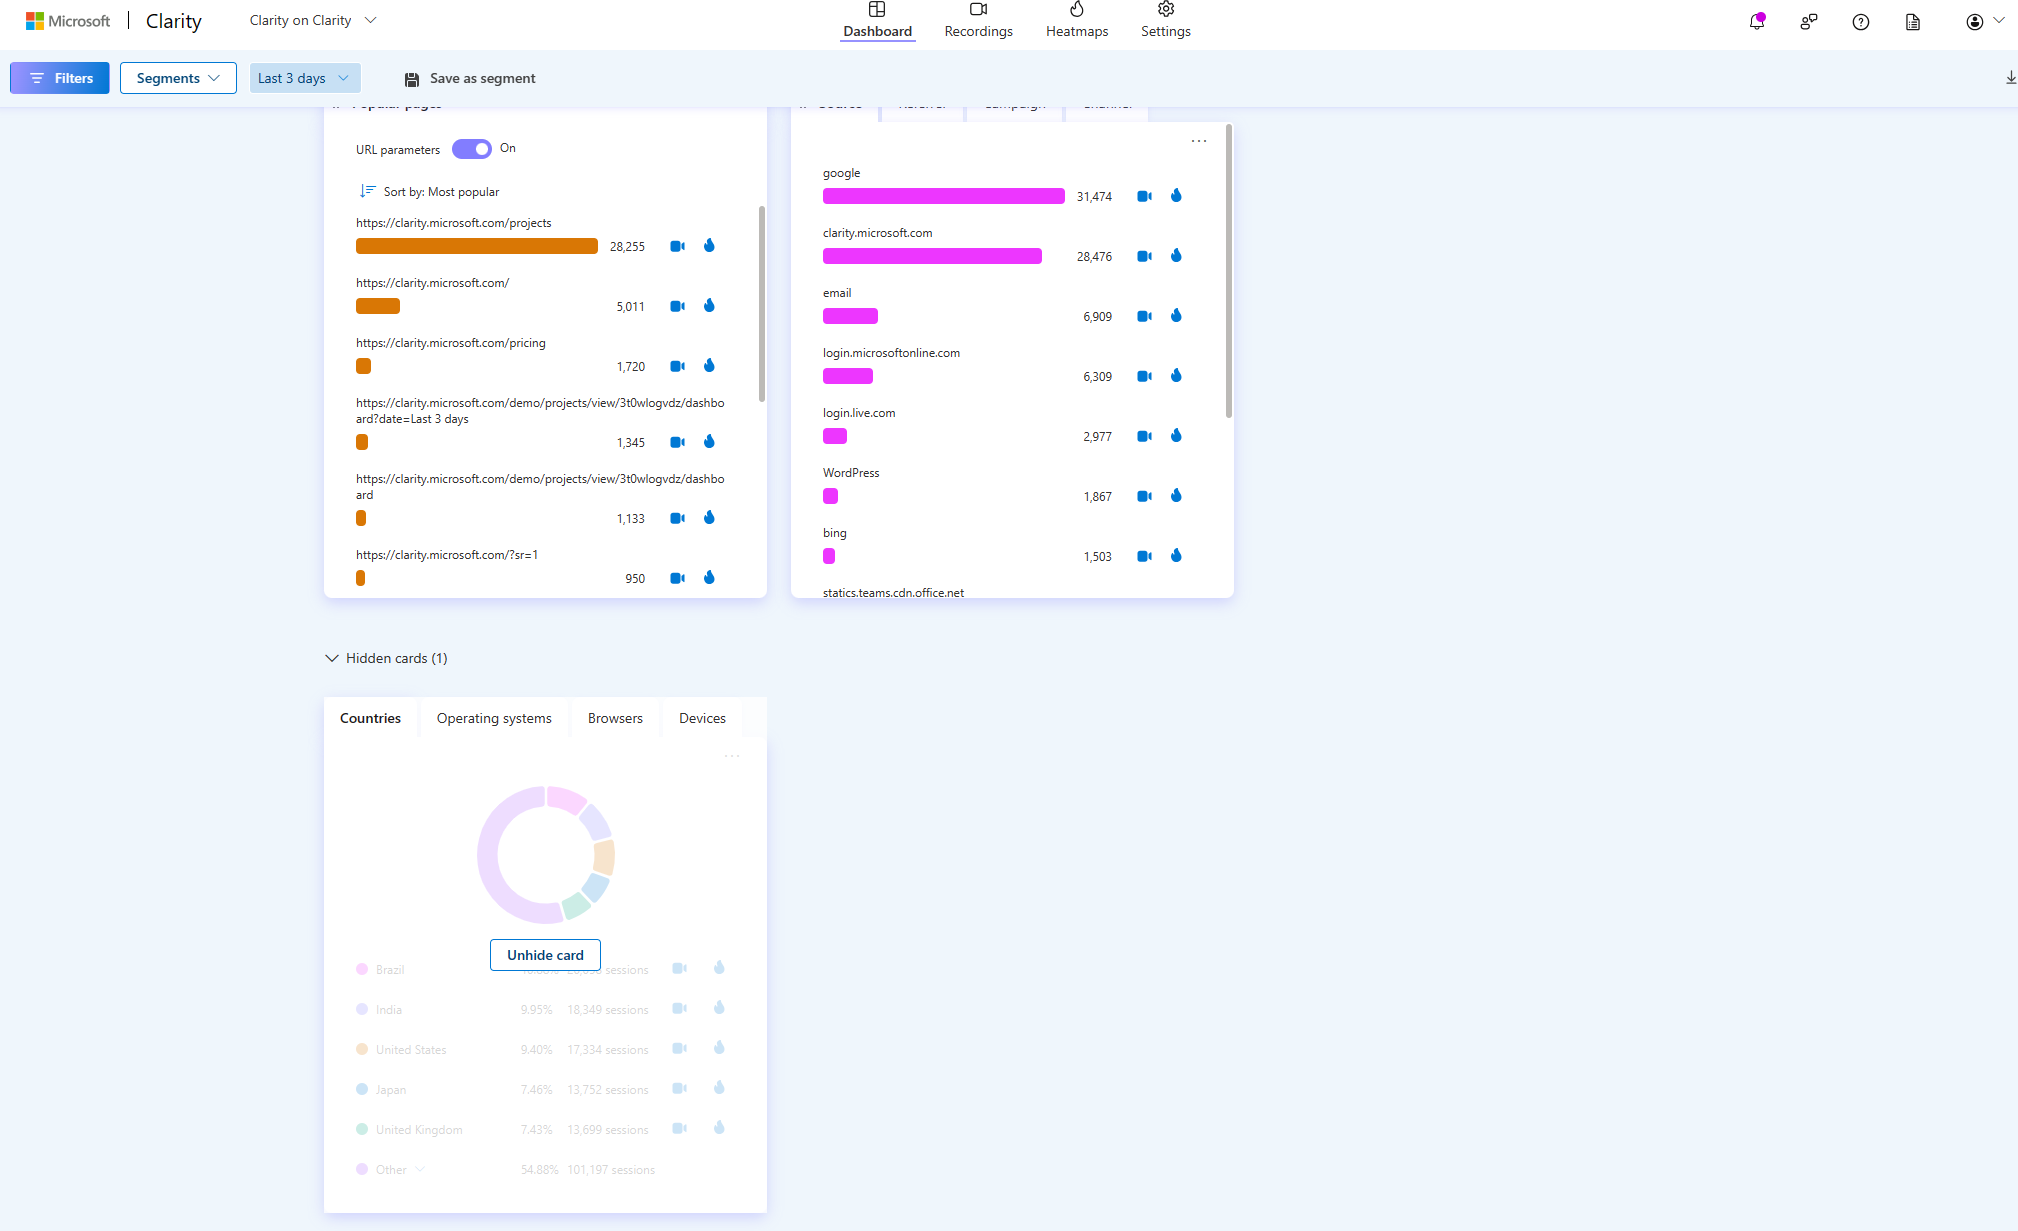
We are aware that not every card is applicable to your project and can clog up your dashboard. Our new hide function makes it simple to get rid of unwanted distractions. This helps you concentrate on the information that is relevant while also organizing your workspace. You may view and re-add hidden cards again at any time, so don’t worry! Additionally hidden cards will not appear when you download dashboard data. This ensures that your downloaded files are as streamlined and relevant as possible.  

Set a Default Tab in a Card

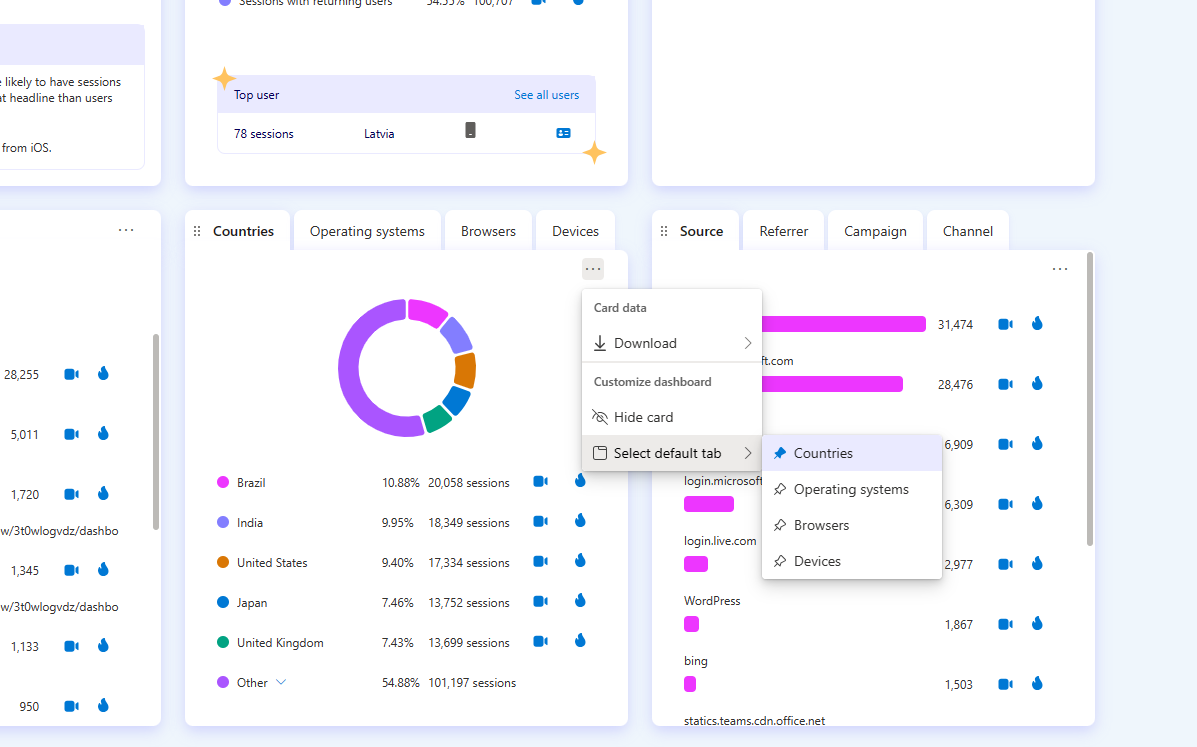
For the cards which have multiple tabs, you can now select which one you would like to have as your default. This ensures the most important information is front and center when you’re in Clarity.  

We’re confident that these new customization features will enhance your Microsoft Clarity experience, making it more efficient, enjoyable, and tailored to your specific needs. Try them out and see how they transform your experience! 

We’re always here to listen and improve, so keep the feedback coming. Your insights help us make Microsoft Clarity the best it can be. Happy customizing! 

5 Browsing Patterns of the Modern Mobile Car Shopper

5 Browsing Patterns of the Modern Mobile Car Shopper

My name is Alex Griffis, and I’m the President of Overfuel, a website and digital retailing platform servicing automotive dealerships across the US. Our customers, both large and small, use our platform to power their digital showrooms and reach more consumers. Whether it’s a franchise dealership (Honda, Nissan, GM) or a pre-owned independent, our job is to provide the best online shopping experience possible to ensure consumers find the car that meets their needs. 
 
Since over 80% of online car shopping starts from a mobile device, we must offer an intuitive, seamless, mobile-first experience. With Microsoft Clarity, we implemented session recordings, click and scroll heatmaps, and insightful analytics to make significant UX improvements to our products. We sampled a variety of websites with varying conversion rates, lead volume, and overall website traffic to look for common threads across different demographics. After seeing many positive results, we’ve highlighted the five most common browsing patterns of the mobile-first car shopper. 

Searching Inventory is the #1 Most-Clicked Action

When a potential customer lands on your website, they want the least path of resistance to finding a vehicle that meets their needs. Overfuel and other leading direct-to-consumer products like Carvana focus on several best practices to drive more conversion:

  1. Lead with inventory search: make it easy for customers to find what they want. Excellent search functionality doesn’t end with makes and models; great search functionality is graceful and allows a margin for error. Detecting common misspellings and making intelligent suggestions based on input significantly improves customer experience.
  2. Follow with vehicle types: the second most common filtering behavior is vehicle type (cars, trucks, SUVs).
  3. Keep everything above the fold: 8 out of every ten customers leave the homepage before scrolling 25% of the page, so keep your calls to action clear and visible above the fold.

Most Consumers Find Live Chat Annoying

Sorry, live chat, but it’s true.

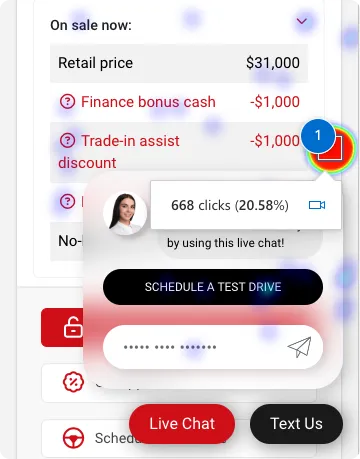
On the vehicle detail page, across several customers with live chat, we found that the #1 most-clicked item was the close button on live chat products. The data supports what we’ve been saying for a long time: stop annoying your customers by interrupting their experience with pop-ups.

If a customer wants to contact you to ask a question, they will! How do we know? Aside from the photo gallery, the remainder of the top 10 most-clicked items are lead-generating: click-to-call, personalize your payment, etc.

Ordering Your Inventory by What Sells Best, Not What Costs the Most, Drives Better Engagement

If you’re leading with price, your SRP becomes stale quickly. It doesn’t allow newer or more popular inventory to cycle in and out. Upon reviewing the data, for the customers who aren’t searching for an exact vehicle, the behavior pattern is as follows:

  • Clicks a vehicle type tile on the homepage (“SUV”)
  • Clicks “Filters” (12.25% of all SRP clicks)
  • Clicks on the first or second vehicle on the SRP (over 15%)

If your most popular SUV sold is an Audi Q5, you’re much more likely to engage a customer with a $30,000 Q5 than presenting them with a $250,000 Lamborghini Urus. Not only does the data support that, but it’s also just more practical.

When consumers are presented with options that match their car search preferences, they obviously convert better.

Great Inventory Photos are King

It may seem obvious, but many dealerships undercut their performance by underinvesting in inventory photos.

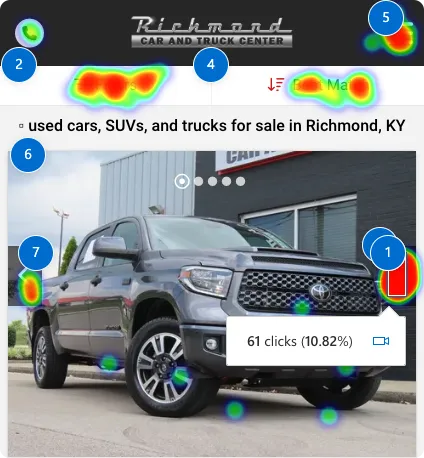
On the search results page (SRP), the most-clicked element on the page is the photo gallery arrow, which we implemented to allow consumers to swipe through the first handful of images on a vehicle. Interacting with photos accounts for 10-15% of all activity on the SRP, seconded by applying specific filters.

Furthermore, the top 5 most-clicked elements on a vehicle detail page (VDP) are all related to the photo gallery. Great inventory photos are critical to establish trust and credibility, not just on a dealership’s website, but more broadly as their inventory is syndicated across referral websites.

Content Unrelated to Inventory Drives Very Little Engagement

Homepage slideshows? Yesterday’s news. Bloated copywriting on landing pages? SEO tactics from nearly a decade ago. Videos? So long as they’re not too distracting and accomplish some goal, such as establishing trust or showing a variety of inventory.

If a dealership offers a compelling warranty, an exchange policy, or specializes in a niche (for example, lifted trucks), lead with that! Establish trust with a headline highlighting your specialties or strengths, then jump straight into conversion funnels:

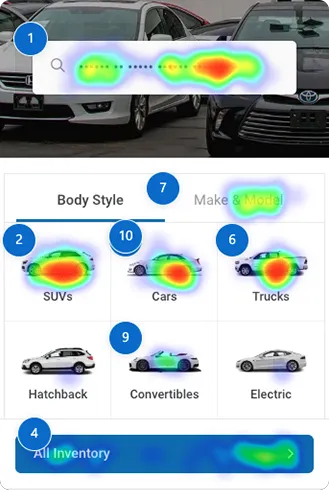
  1. Inventory search accounts for 24.87% of homepage clicks.
  2. Vehicle type tiles (cars, trucks, SUVs): 13.97% of homepage clicks.
  3. “All Inventory” button near the bottom of the fold: 9.2% of homepage clicks

Key Takeaways from Research

  1. Lead with inventory
    Make it easy for your customers to find what they’re looking for.
  2. Invest in quality photography
    Your inventory is your billboard, both on your dealership’s website and across major syndication websites
  3. Limit distractions and make car shopping frictionless
    There are many ways to generate more leads at the top of the funnel, but it’s up to the dealership to convert a buyer once they’re on the website. Limit tools like live chat and pop-up widgets from impeding customer experience.
  4. Ensure filters are seamless
    Although “Make” is the #1 filter across desktop and mobile, it’s closely seconded by feature (Bluetooth, third-row seat, etc.) and color. Listing hundreds of colors leads to a poor user experience, which is why Overfuel has standardized interior and exterior colors down to ten of the most common options.
  5. Don’t make customers scroll
    On average, 8 out of every 10 customers have moved on before scrolling 25% of a page. It’s critical to keep your website funnel focused by putting photos and calls to action above the fold.
Harnessing Microsoft Clarity Data in Power BI: A Seamless Integration Guide 

Harnessing Microsoft Clarity Data in Power BI: A Seamless Integration Guide 

In the field of data analytics, obtaining insights and facilitating strategic decision-making depend on the integration of many tools and platforms. The Data Export API is a robust feature that Microsoft Clarity just released that enables users to export dashboard data programmatically. Here we will explain how to improve your data visualization and analysis by integrating Power BI.

Why Integrate Microsoft Clarity with Power BI? 

Data analysts and marketers have access to a multitude of new opportunities with Power BI’s integration of Microsoft Clarity’s Data Export API. Rich behavior-based analytics data from Clarity can be fed into Power BI to enable the creation of more dynamic dashboards, reports, and data visualizations. Deeper insights into user behavior on your website are made possible by this symbiosis, which empowers data-driven decision-making to maximize user experience and conversion rates.

Setting the Stage: Generating API Access Tokens 

Before diving into Power BI, the first step is to generate an API access token in Microsoft Clarity. This token is essential for authenticating your data requests from Clarity to Power BI. 

  1. Log in to your Microsoft Clarity account. 
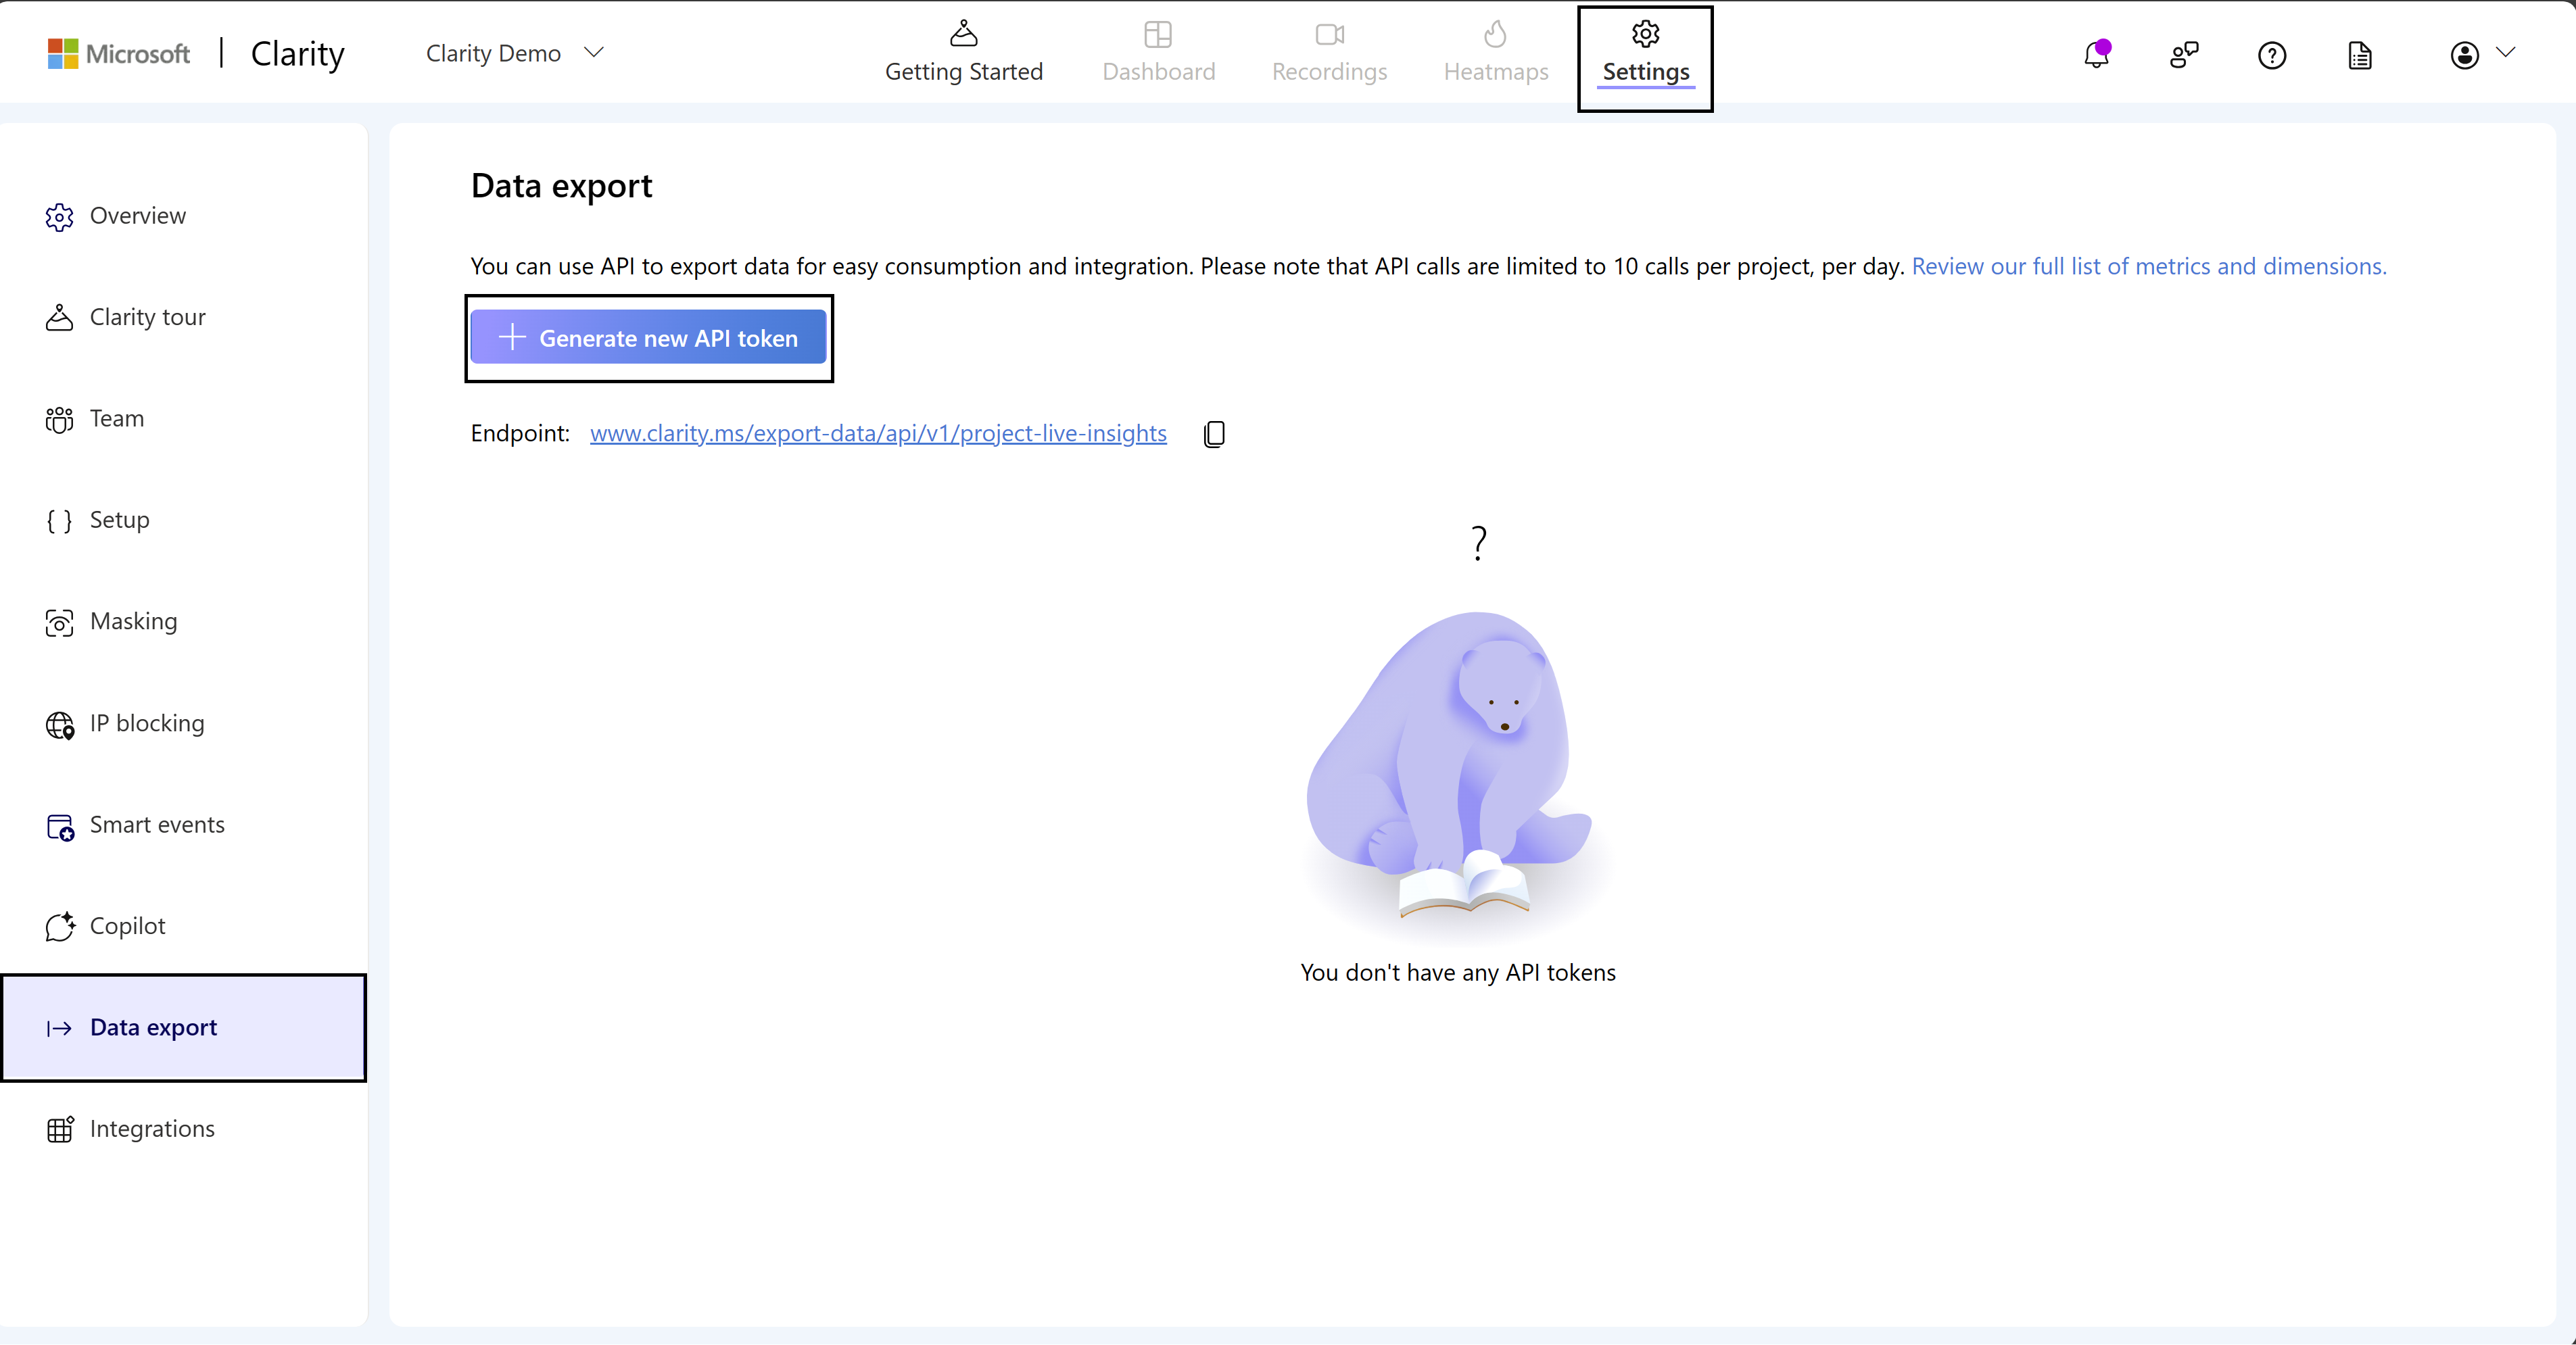
  1. Navigate to the settings and locate the Data Export section. 
  1. Generate a new API token, and store it securely – you’ll need it soon. 

Connecting Microsoft Clarity to Power BI 

With your API token in hand, you’re ready to connect Clarity to Power BI: 

  1. Open Power BI Desktop: Begin by launching Power BI Desktop. If you don’t have it installed, it’s available for free from the Microsoft Store. 
  1. Get Data from the Clarity API: Go to the ‘Home’ tab and click on ‘Get Data’. Choose the ‘Web’ option as your data source. 
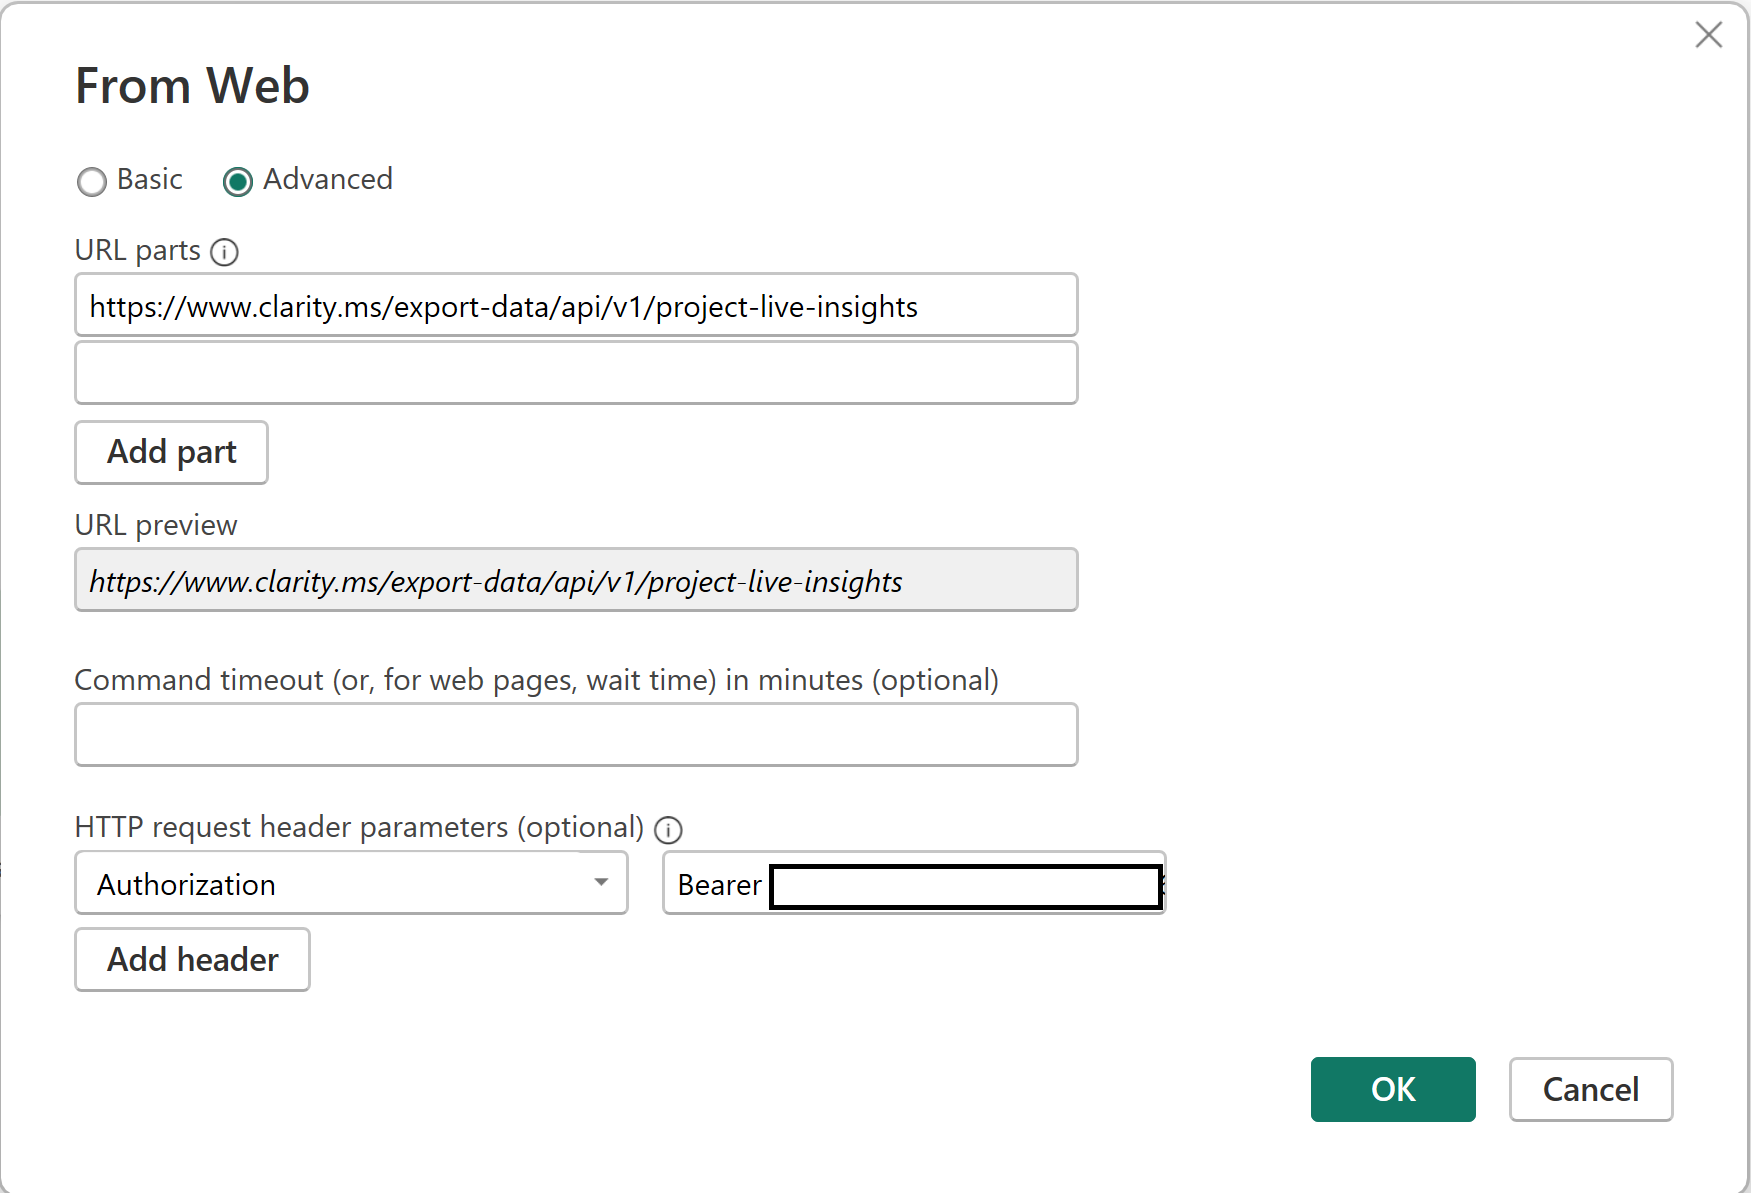
  1. Enter the API Endpoint and Headers: In the URL field, input the endpoint URL of the Microsoft Clarity Data Export API. Then, use the ‘Advanced’ option to specify the HTTP request header parameters. Add a header with the key Authorization and the value Bearer YOUR_API_TOKEN

Transforming the JSON Data 

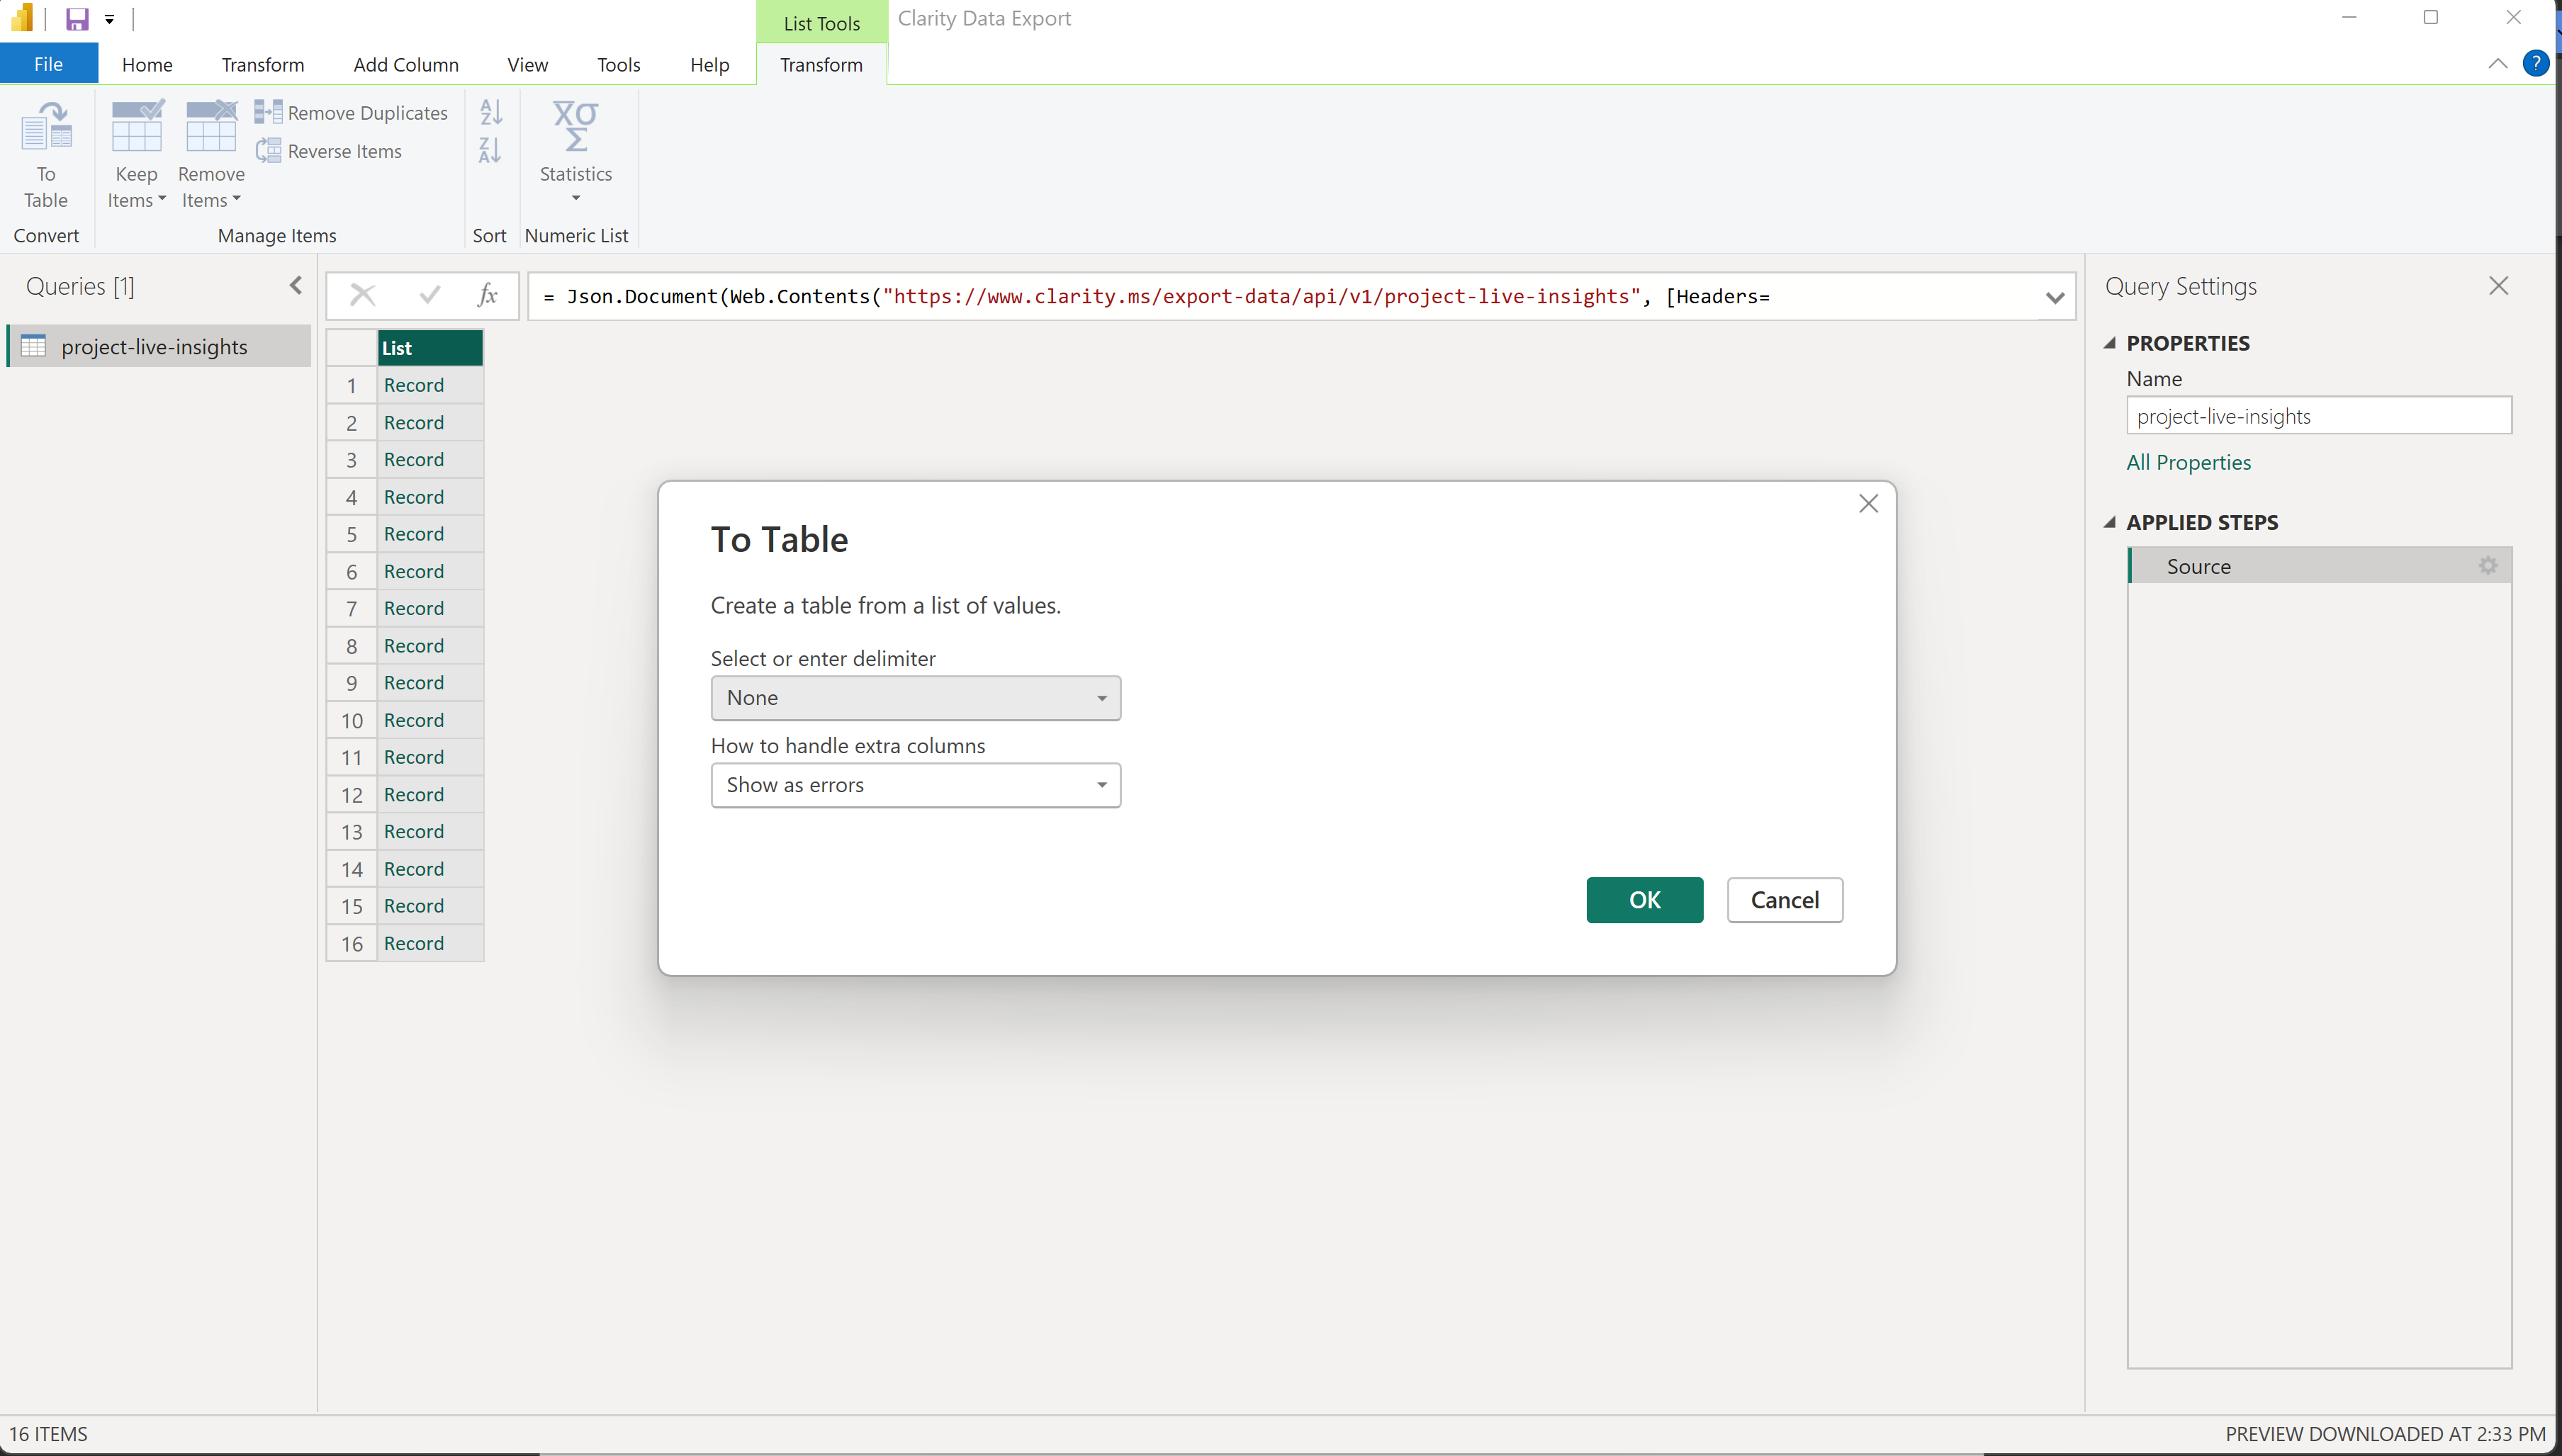
Clarity’s data will be in JSON format, which Power BI is adept at handling. Once data is loaded, select transform data to format it in a tabular form suitable for analysis: 

1. Convert the JSON response to a table format. 

2. Expand the nested columns to your needs. 

3. Rename and adjust columns as necessary.

 From there on, you can do whatever filtering and mixing with other data according to your scenario. 

Visualizing Clarity Data in Power BI 

With your data now in Power BI, the fun part begins – visualization: 

  1. Explore Power BI’s Visualization Tools: Utilize Power BI’s array of visualization tools to turn your Clarity data into insightful graphs, charts, and dashboards. 
  1. Customize Your Reports: Tailor your reports to highlight key metrics and insights relevant to your website’s user behavior. 
  1. Share Your Insights: Publish your Power BI reports to share with your team or stakeholders, providing them with actionable insights based on Clarity’s data. 
  1. Mix your Data: Connect to other data sources and mix it with Clarity data to enrich your insights and empower your decision-making on different aspects of your business. 

Integrating Microsoft Clarity with Power BI not only streamlines the data analysis process but also enriches the quality of insights you can derive. This connection empowers you to leverage Clarity’s detailed web analytics in conjunction with Power BI’s advanced data visualization and reporting capabilities, leading to more informed, data-driven decisions for your website or digital product. 

Embrace this integration and start exploring new dimensions in your data today! 

3rd Year of Clarity

3rd Year of Clarity


This year at Clarity has been a thrilling journey, marked by significant transformations in our design and features. These enhancements have not only elevated our brand but also enriched the user experience, reflecting our commitment to innovation and excellence.

Connect the Clicks: Microsoft Clarity Data Export API 

Connect the Clicks: Microsoft Clarity Data Export API 

Unleashing the full potential of your website analytics just got easier with Microsoft Clarity’s latest feature: the Data Export API. Step into a world where data access is as simple as a few clicks. 

Harness the Power of Data 

This new feature streamlines the task of downloading dashboard data, making it more accessible for advanced analysis or integration with other systems. By offering a straightforward method to export data, it addresses the common challenge of managing complex analytics, thereby enhancing the efficiency and effectiveness of data-driven decision-making. This is particularly beneficial for those who are serious about analytics and seek a more efficient way to analyze their aggregated data or integrations with other tools and systems.

A Token of Security 

Your security concerns are top of mind, which is why accessing the Data Export API is gated behind a JWT token. Rest assured, your data is not just a click away from anyone – it’s safeguarded behind robust authentication, granting peace of mind alongside access. 

Data at Your Fingertips 

Once you’re set up with your token, you’re ready to command your data. Extract insights based on dashboard metrics like Traffic, Engagement Time, and Scroll Depth, segmented by dimensions such as Browser, Device, and OS. Your data is not just available; it’s now customizable to your needs. 

Embrace the API Lifestyle 

Here’s a taste of the simplicity we’re offering: 

Balance and Fairness in Data Utilization 

While we aim to provide expansive access, we also uphold the balance with a usage cap – 10 requests per project per day. This ensures all users enjoy a smooth experience without overloading the system. 

Stay Current, Stay Secure 

Keep your data secure by refreshing API tokens regularly, especially when users leave the project. This isn’t just about keeping things tidy; it’s about ensuring that your data remains in the right hands. 

Ready to Elevate Your Analytics? 

We invite you to explore the full capabilities of the Data Export API. Check out our detailed documentation to get started. If you encounter turbulence on your data journey, our support team is ready to assist. 

Clarity Monthly Recap [October 2023]

Clarity Monthly Recap [October 2023]

As the leaves turn and October comes to an end, Microsoft Clarity has not been idle amidst the autumnal transformation. Our team, fueled by feedback and pumpkin spice lattes, has been hard at work to bring a suite of new features to enhance your experience. This month’s recap is brimming with updates that promise to streamline your workflow and provide deeper insights into your mobile and web analytics. 

Clarity Redesigned  

The most noticeable difference you’ll see coming from the month of October is our new look. Don’t worry, it’s not just a Halloween costume, it is here to stay! Microsoft Clarity’s interface has undergone a significant redesign, enhancing usability and aesthetics. This all derived from user feedback, which is designed to spark an intuitive and innovative environment to use Microsoft Clarity.  

Alongside the delightful redesign comes the enhanced feature improvements. Each improvement was carefully created to make Clarity efficient and easy. We strive to make Microsoft Clarity user friendly for everyone, so you don’t need a background in data analytics to achieve amazing results. Learn about all the new redesign features here. Most would call that a good month of work, but we have a few more treats! 

Zapier Integration 

You asked and we delivered! Microsoft Clarity got a supercharge with its latest integration with Zapier. Unleash the power of automation with the ability for real-time monitoring, automatic notifications, and customizable alerts. But wait! There is more, much more, in fact It’s 2,000 plus more applications that are now able to be seamlessly connected with Clarity, thanks to Zapier.  

Live Users on Mobile 

As we continue exploring the ever-evolving landscape of digital analytics, it’s important to emphasize the significance of real-time data in understanding your website’s reach. For those who depend on this immediacy to make informed decisions, there’s an exciting development to share. The “Live Users” feature, a tool that was previously limited to desktop users, has now been extended to mobile platforms. This expansion means that mobile users can now enjoy the same real-time insights into website traffic and user engagement that desktop users have been benefiting from, marking a significant step in our commitment to providing comprehensive analytics tools across all devices.  

Mobile SDK Updates    

The latest update for our Android SDK is version 2.0.0, which marks a significant advancement in our technology. This version is particularly notable for its enhanced data capture methodology, designed to improve both the efficiency and resilience of the SDK. In response to customer feedback, we’ve introduced several new features. One of these is the setCustomSessionId API, which allows SDK users to assign custom IDs to their sessions. This feature not only facilitates the tracking of unique features within your app but also enables the synchronization of session data across various platforms. Additionally, we’ve implemented a new function that gives users the ability to control the capture of specific screens within their app. This is achieved through the ‘allowedActivities’ and ‘disallowedActivities’ configuration lists, which can be set during the initialization of the Clarity SDK in your app’s code, thereby offering a customizable experience in terms of screen capture management. 

As we wrap up this month’s recap, we hope the new features of Microsoft Clarity not only meet your expectations but exceed them. We’re committed to evolving with your needs, and October’s offerings are a testament to that promise. Stay tuned for what’s next, unlike our beloved pumpkin spice lattes, Microsoft’s innovation is always in season. 

10 Easy Steps to Increase your Black Friday Sales with Microsoft Clarity

10 Easy Steps to Increase your Black Friday Sales with Microsoft Clarity


As Black Friday approaches, retailers are gearing up for one of the busiest shopping days of the year. With competition fiercer than ever, it’s crucial to leverage every tool at your disposal to maximize conversion rates. Enter Microsoft Clarity – a powerful, free analytics tool that offers deep insights into user behavior. In this blog, we’ll explore 10 key features of Microsoft Clarity that can help you turn Black Friday browsers into buyers.

1. Heatmaps: Visualizing User Interest
Heatmaps are a cornerstone feature of Microsoft Clarity, providing a color-coded representation of where users are clicking on your site. By understanding which areas of your Black Friday pages are attracting the most attention, you can strategically place key offers and calls-to-action to boost conversions.

2. Session Recordings: Replay the Customer Journey
Session recordings are like a window into the user’s experience on your site. Watch real-time interactions to pinpoint where customers are getting stuck and use these insights to streamline the path to purchase. This feature is invaluable for identifying and rectifying roadblocks that could be hindering your Black Friday sales.

3. Conversion Maps: Tracking the Path to Purchase
Conversion maps allow Shopify users to see which specific actions are resulting in conversions. This is a great way to put your best products first to capture as many sales as possible. Take a closer look at Conversion Maps here!

4. Dashboard Insights: Your Data Command Center
Clarity’s dashboard gives you an overview of your website’s performance at a glance. Quickly assess how users are interacting with your Black Friday deals and make data-driven decisions to optimize your sales strategy in real-time. We have an extra bonus for Shopify users that have access to e-commerce insights such as viewed products, checkout abandonment, and purchases.

5. Live Users: Harnessing Real-Time Data

Harness the power of immediate insight with Microsoft Clarity’s live user monitoring. This feature offers a window into customer interactions with your Black Friday deals as they unfold in real-time for desktop and mobile. Unlike the 48-hour lag experienced with tools like Google Analytics, Clarity’s instantaneous data stream empowers you to make on-the-spot improvements, ensuring that you’re not just reacting to trends, but actively shaping them. Seize sales opportunities the moment they arise and keep your Black Friday momentum going strong, without having to wait for Cyber Monday to make your move.

6. Rage Clicks: Identifying User Frustration
Rage clicks happen when a user repeatedly clicks on an element, indicating confusion or frustration. Clarity helps you spot these areas so you can address potential issues before they cost you sales on Black Friday.

7. Dead Clicks: Revealing Non-interactive Elements
Dead clicks occur on elements that look interactive but aren’t. This can lead to a poor user experience and lost sales. With Clarity, you can quickly find and fix these deceptive design elements.

8. Scroll Tracking: Understanding Content Engagement
Scroll tracking shows you how far down the page users are scrolling, helping you determine where they lose interest. Place your most compelling Black Friday offers above the fold to ensure they’re seen by more visitors.

9. JavaScript Errors: Keeping Your Site Smooth
Clarity automatically detects and reports JavaScript errors that could be disrupting the user experience. Keep your site running smoothly during the Black Friday rush by quickly addressing these issues.

10. Integrations: Combining Forces for Greater Insight
Microsoft Clarity can be integrated with other tools like Zapier, Google Analytics, and more to get a comprehensive view of your data. Combine forces to gain a deeper understanding of your audience and refine your Black Friday marketing strategies.

Conclusion:
Black Friday is a prime opportunity to boost your sales, and Microsoft Clarity is the secret weapon you need to optimize your website’s performance. By leveraging the features we’ve discussed, you can gain valuable insights into user behavior, improve the customer journey, and ultimately increase your conversion rates. Don’t let technical glitches or design flaws stand in the way of your Black Friday success. Harness the power of Microsoft Clarity and watch your sales soar.