Mastering Mobile App Analytics: Unveiling Key Facts and Expert Tips

Mastering Mobile App Analytics: Unveiling Key Facts and Expert Tips

What is mobile app analytics? 

Mobile analytics is the heartbeat of successful mobile applications! It’s the process that breathes life into your apps, helping you understand user behavior and optimize performance for a truly exhilarating user experience.

Essential for any business striving for app excellence, mobile app analytics empowers you to understand how users interact with your app, which features are a hit, and what challenges they encounter. Armed with these data-driven insights, you’ll have the tools to make meaningful improvements, resulting in a thriving and prosperous app that stands out from the crowd. So, dive into the world of mobile analytics and watch your app take flight!

How do app analytics work? 

Mobile analytics is the powerhouse behind your app’s success, working tirelessly to collect and process valuable data. When a user interacts with your app, a treasure trove of information is gathered, encompassing device type, operating system, app version, screen size, approximate location, user ID, session duration, events, errors, and more. All of this data is then sent to a server, where it undergoes analysis and is securely stored.

This aggregated data is transformed through various methods into a goldmine of insights for you, the end user. It’s like having a magic crystal ball that reveals user behavior patterns, preferences, and pain points, enabling you to optimize your app for ultimate user satisfaction and engagement.

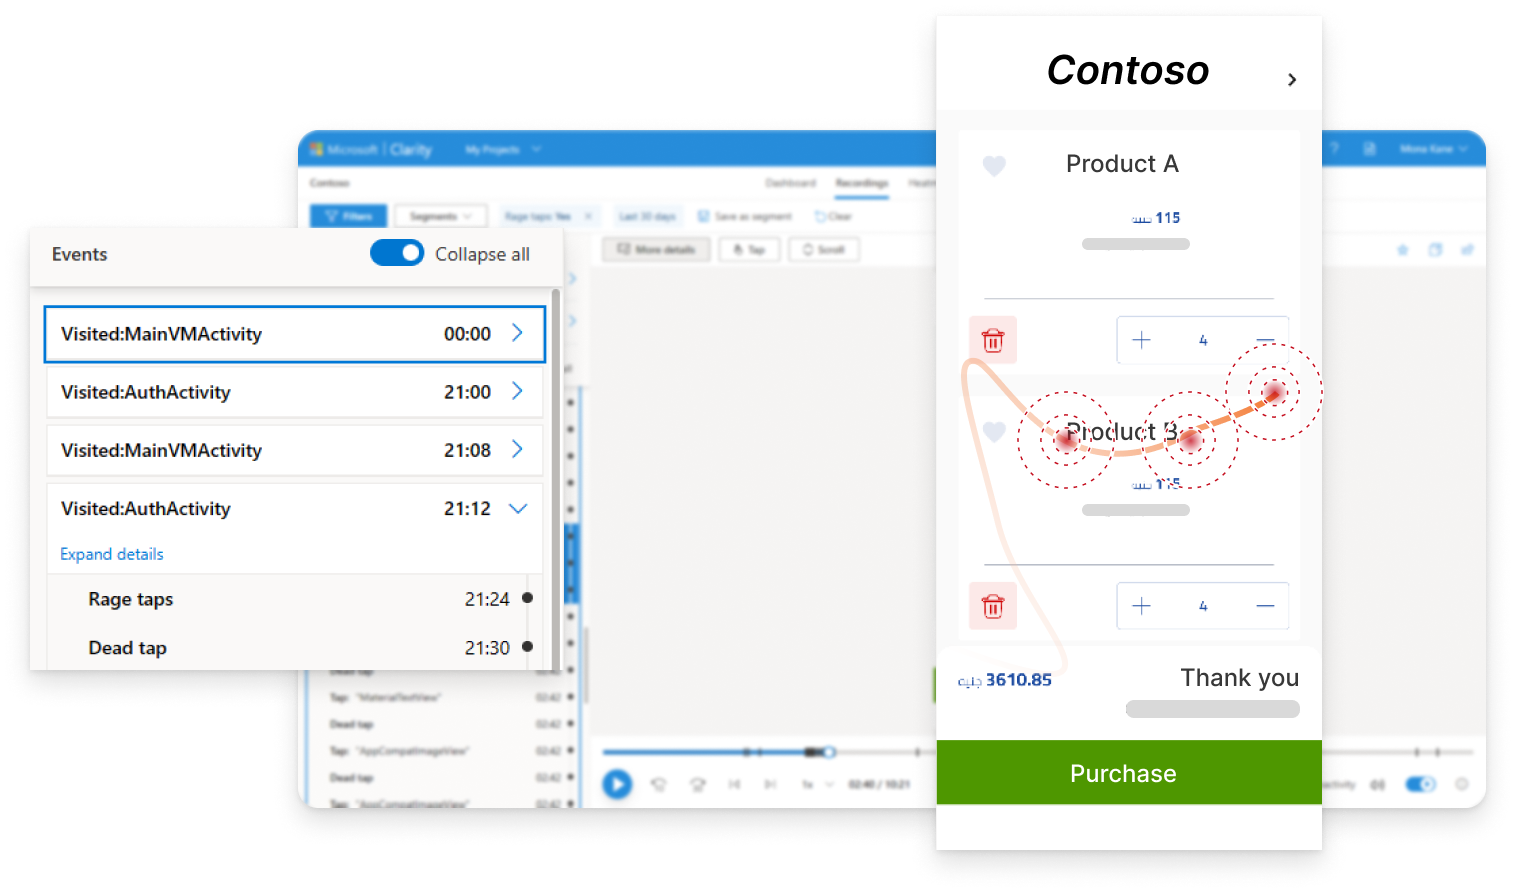
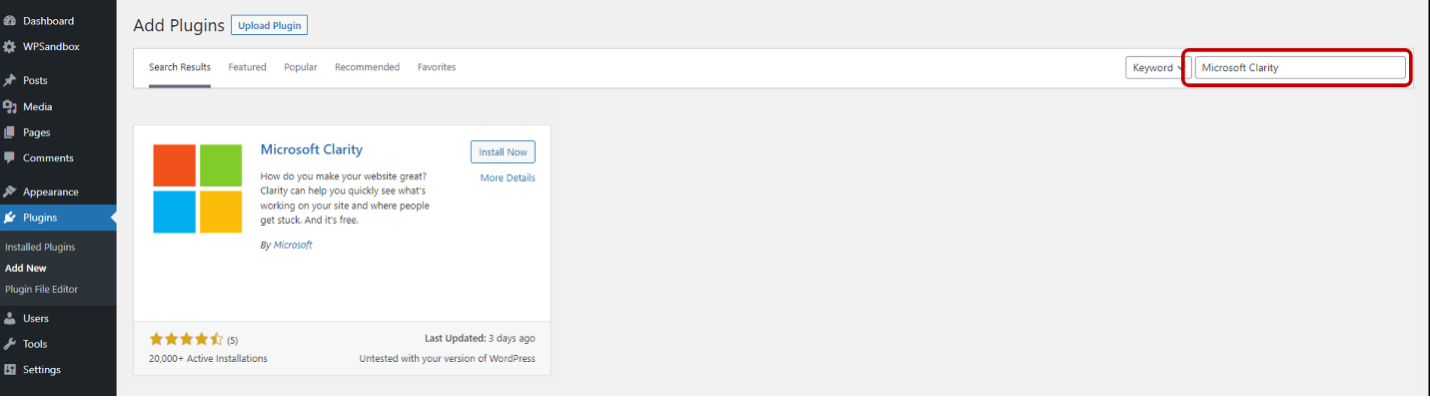
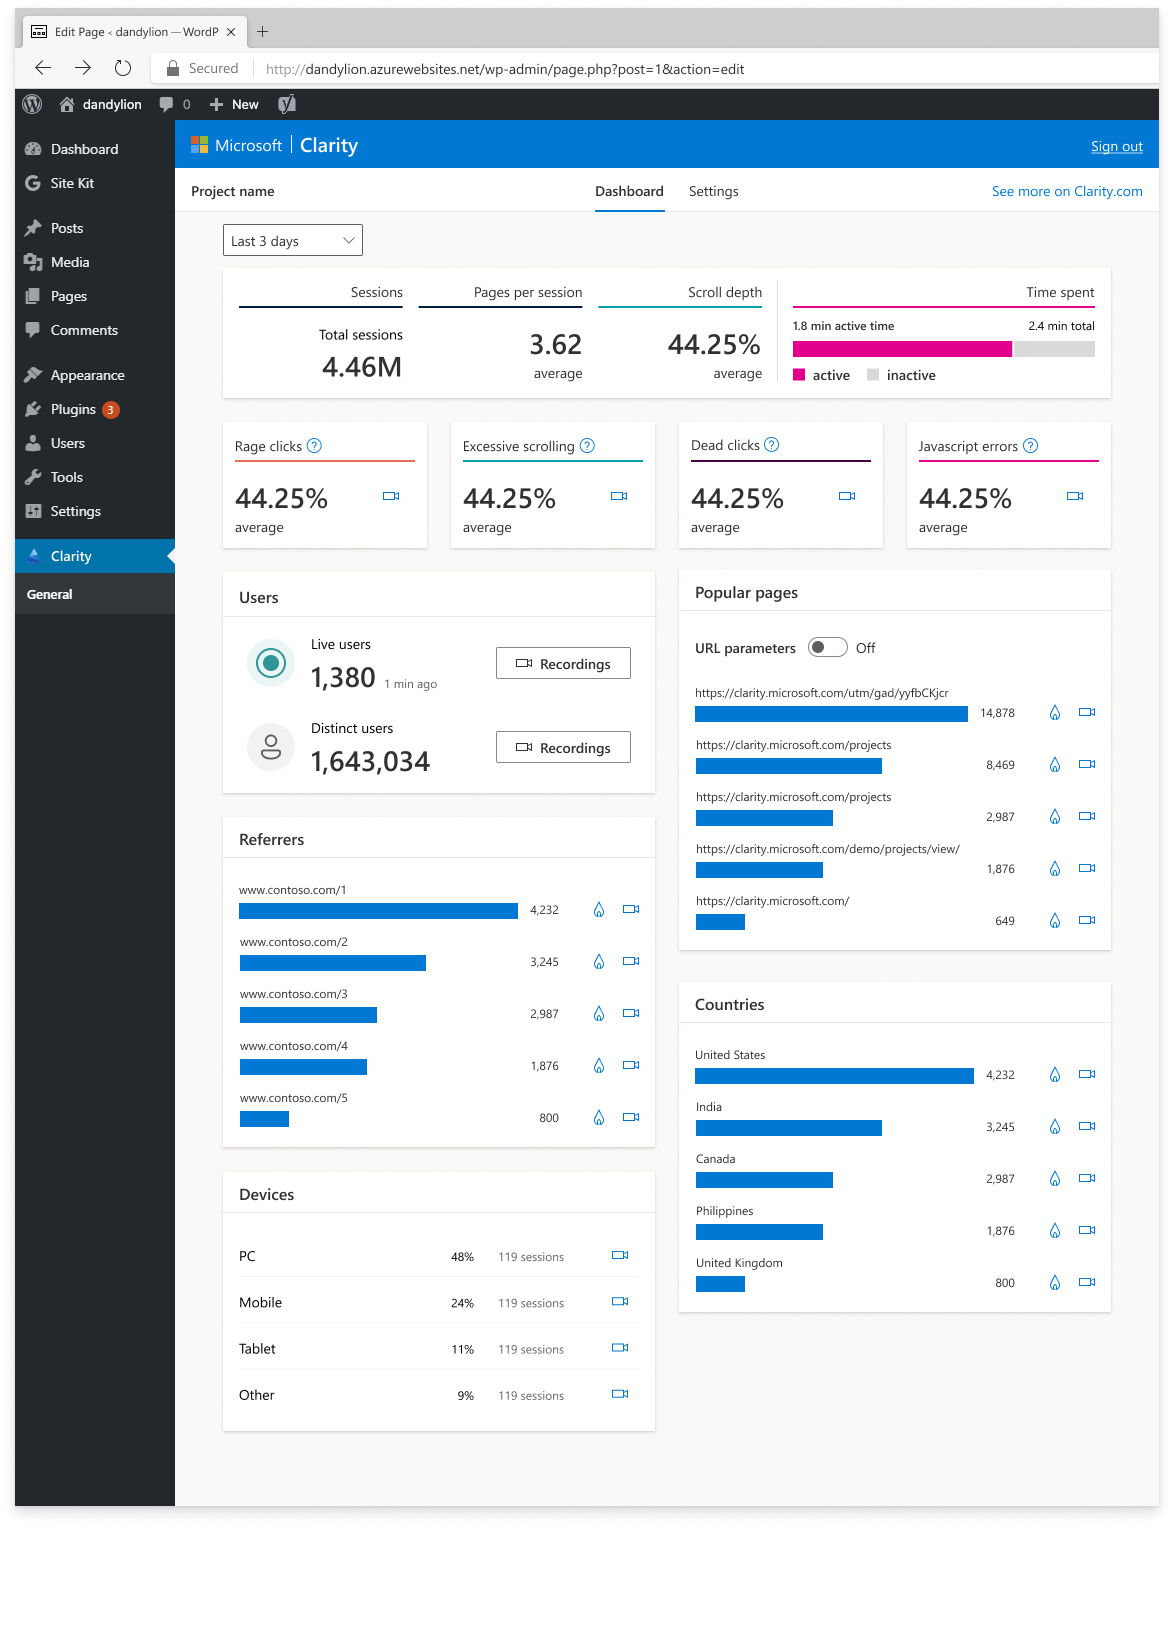
While some app analytics rely on video/image analysis, there are more efficient techniques available. For instance, Microsoft Clarity for Android apps utilizes low-level drawing commands to reconstruct walkthrough-style videos of users’ sessions. This brilliant approach minimizes the overhead on network consumption, ensuring your users enjoy a seamless experience without unnecessary burdens.

Why should I use a mobile app analytics tool? 

Mobile analytics can help answer questions such as: 

– How do users navigate through the app and what features do they use? 

– How do users behave differently across different segments, such as platforms, operating systems, locations, or devices? 

– How do users react to changes or updates in the app? 

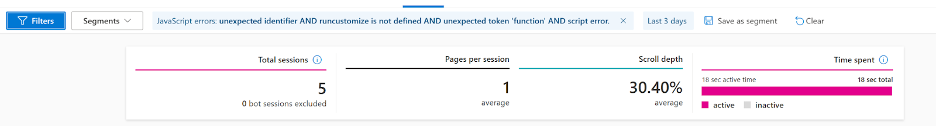
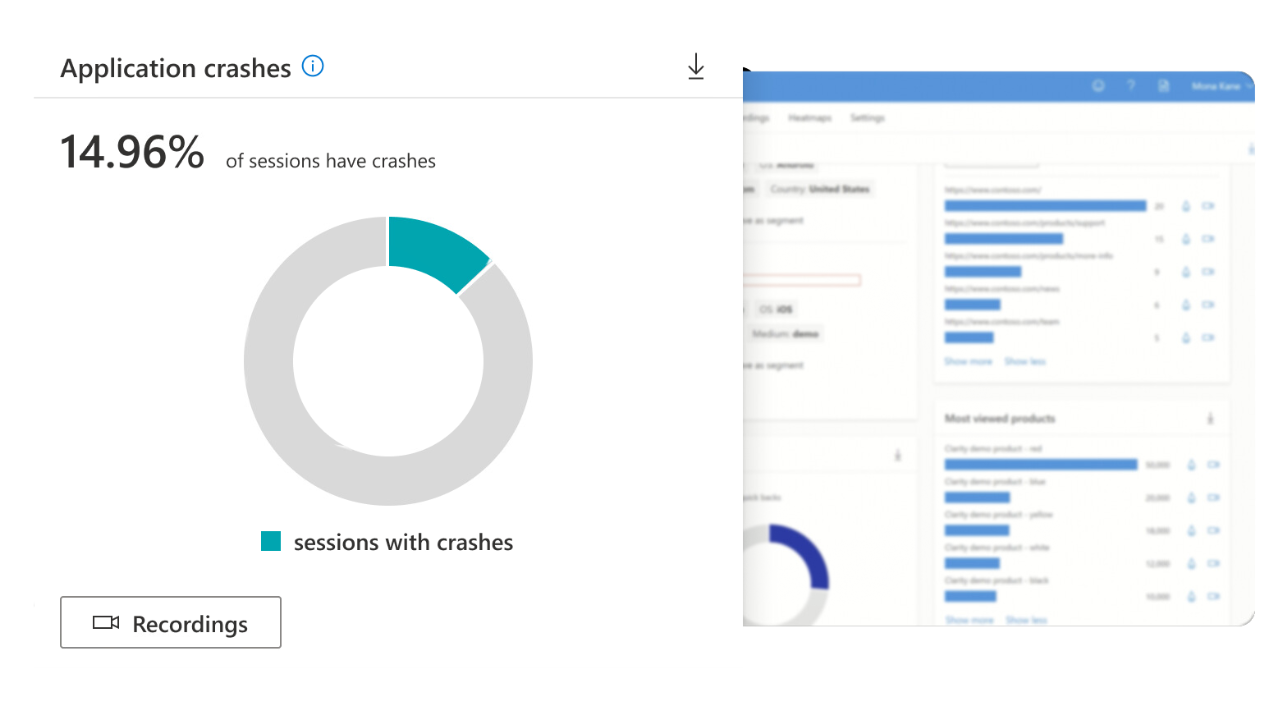
– Did my users face any crashes or errors while they are navigating the app? 

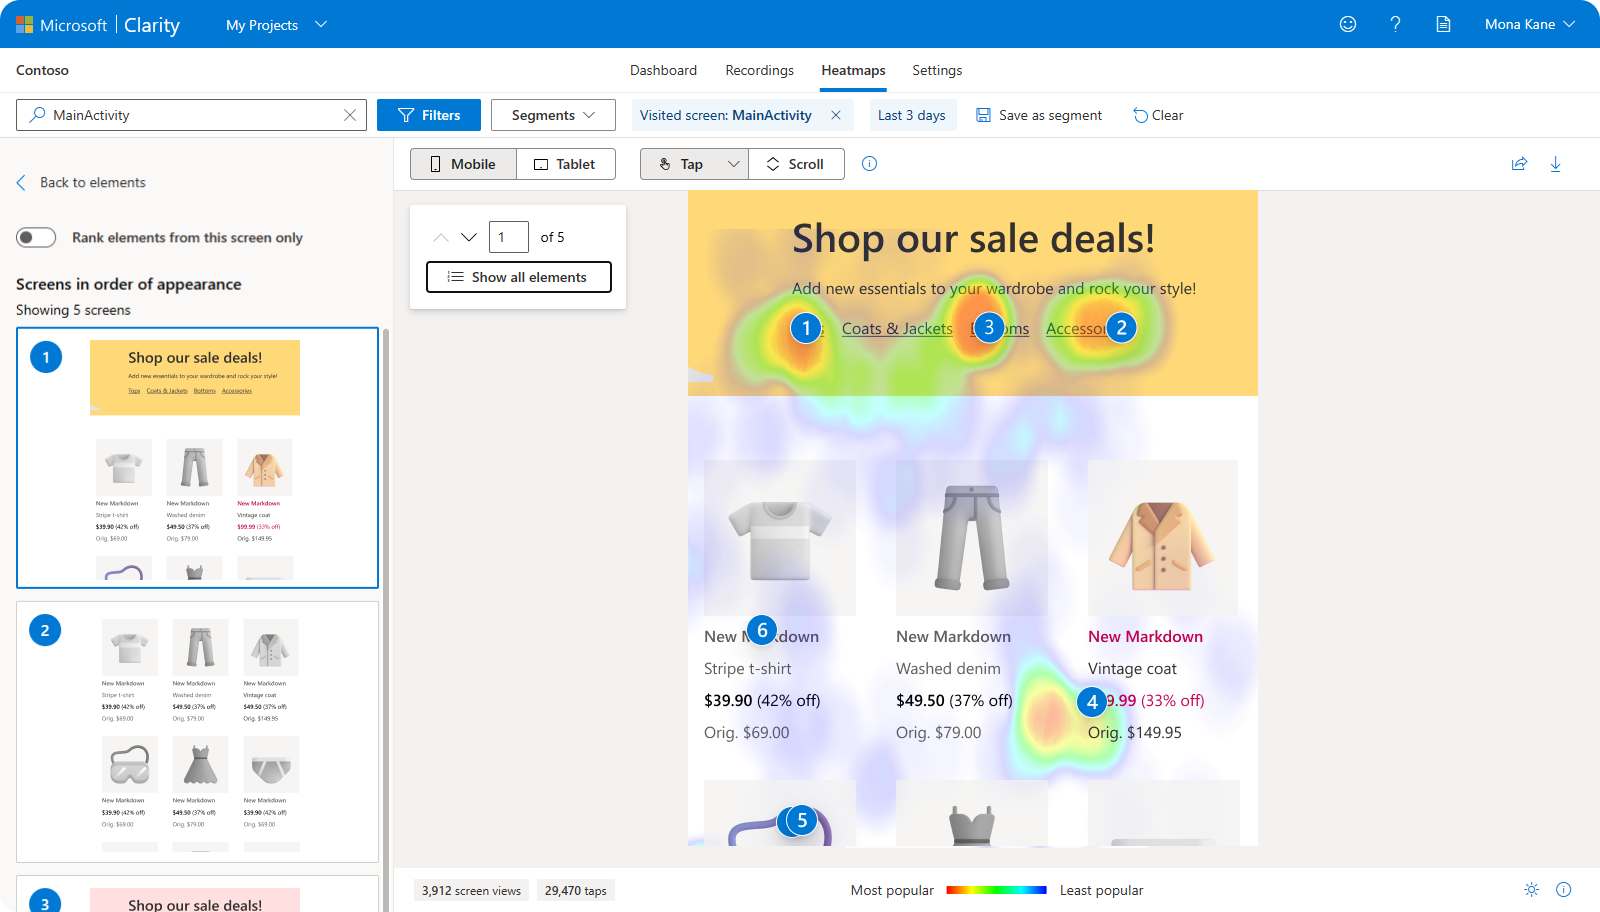
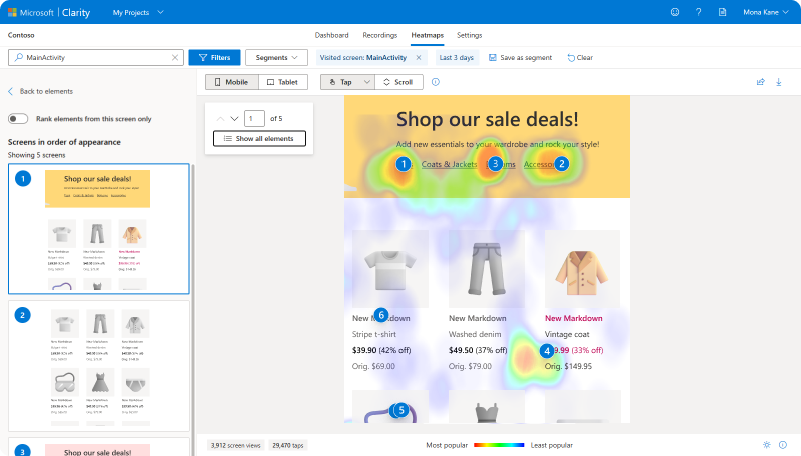
– which elements are most clicked and which elements are ignored in my app? 

Mobile analytics is essential for any app that wants to succeed in the competitive and dynamic mobile market. By using mobile analytics, app developers and marketers can gain valuable insights into user behavior and preferences, and use them to improve their app performance and user satisfaction. 

What are the types of mobile analytics? 

There are different types of mobile analytics that can provide different insights and benefits. Here are some of the most common ones: 
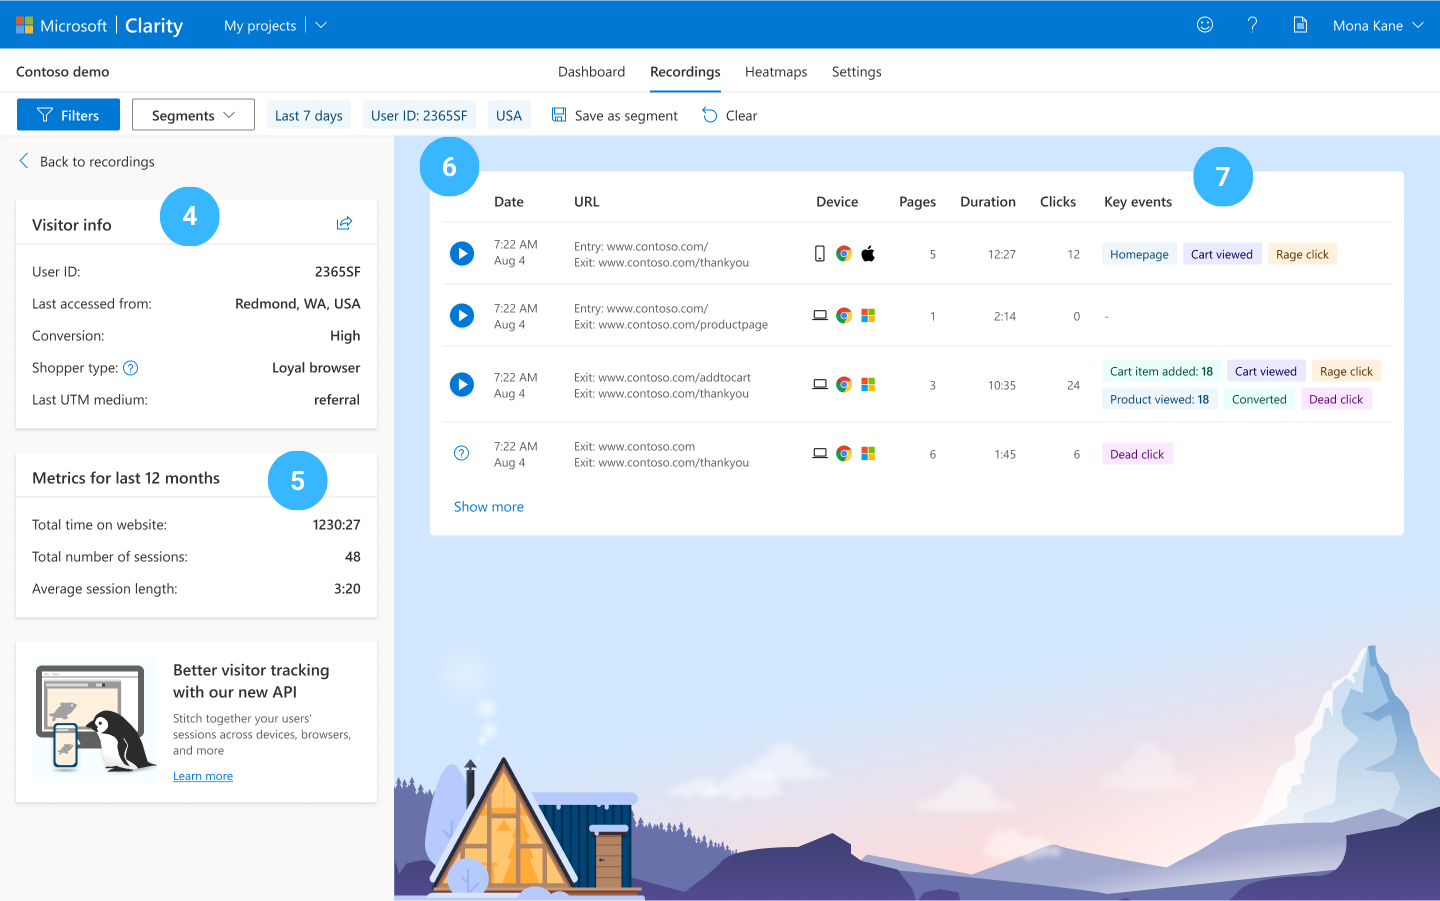
User analytics: This type of analytics focuses on who the users are, where they come from, how they find the app, what devices and platforms they use, how often they use the product, how long they stay. User analytics can help to segment the audience, identify user personas, optimize user acquisition and retention strategies, and personalize the content and offers. 

Behavioral analytics: This type of analytics focuses on how the users interact with the app, what features they use, what actions they take, what content they consume,and what captures their attention. Engagement analytics can help to measure user satisfaction, loyalty, and advocacy, identify user pain points and preferences, improve user interface and functionality, increase user engagement and retention, and encourage user referrals and reviews. 

Performance analytics: This type of analytics focuses on how the app performs in terms of speed, stability, reliability, compatibility, security, and usability. Performance analytics can help to monitor and troubleshoot technical issues, optimize app performance and quality, ensure compatibility across devices and platforms, enhance security and privacy, and improve user experience and satisfaction. 

Conversion analytics: This type of analytics focuses on how the users complete the desired goals or outcomes of the app, such as making a purchase, signing up for a subscription, downloading a resource, or completing a form. Conversion analytics can help to measure and optimize the conversion funnel, identify and remove conversion barriers, test and improve the design and copy of the app, increase conversion rates and revenue, and evaluate the return on investment (ROI) of the product.

How can different teams in my company use and benefit from mobile app analytics? 

Different teams may use mobile analytics for different purposes, depending on their goals and challenges. Here are some examples of how mobile analytics can help product teams achieve success: 

Product teams 

Product managers can use mobile analytics to understand how users interact with the app, what features are most popular, what pain points or issues they encounter, and how to improve the user experience and retention. A product team that is launching a new app or feature may use mobile analytics to test and validate their assumptions and optimize their product-market fit. 

Technical teams 

A development team that is troubleshooting a technical issue or a user complaint may use mobile analytics to diagnose and resolve the problem as quickly as possible. They may use metrics such as crash rate, error rate, and device processing powers, to identify the root cause of the issue, and test and deploy fixes. Developers can also use mobile analytics to monitor the app’s stability, performance, and quality, identify and fix bugs or errors, optimize the app’s speed and resource consumption, and implement new functionalities or integrations. 

Marketing teams 

Marketers can use mobile analytics to track the app’s acquisition, engagement, and conversion rates, segment and target users based on their behavior and preferences, measure the effectiveness of marketing campaigns and channels, and increase the app’s visibility and reach. 

How to Effectively Utilize Mobile App Analytics for Your Business? 

Here are some tips to help you get started:

  1. Define your app goals and key performance indicators (KPIs):  Before you can measure and analyze your app data, you need to have a clear idea of what you want to achieve with your app and how you will track your progress. For example, some common app goals are increasing user satisfaction, engagement, retention, and conversions.
  1. Determine your budget: how much are you willing to spend and which features are the most essential to you? Most tools have different traffic intervals and different features for premium subscriptions. Microsoft Clarity is a 100% tool that will never ask you for upgrades.  
  1. Choose the right mobile app analytics tools: There are many mobile app analytics tools available in the market, each with its own strengths and weaknesses. Depending on your app goals and KPIs, you may need different types of tools to collect and analyze your app performance data. For example, some tools are specialized in collecting and analyzing app traffic, such as Google Analytics for Firebase. Some tools are focused on analyzing user behavior such as Microsoft Clarity or UXcam. Some tools are designed to measure app performance and quality, such as Crashlytics. Microsoft Clarity Mobile SDK gives you everything you need in one single platform. Learn more about the features here
  1. Implement mobile app analytics correctly. Ensure that your app has the necessary permissions to access device data, that your app events and parameters are named consistently and accurately, and that your app privacy and security policies are compliant with the relevant regulations.  
  1. Act on your mobile app analytics insights. The final step of effectively utilizing mobile app analytics for your business is to act on the insights you have gained from your app data analysis. You can use the insights to improve your app design, functionality, usability, content, marketing, monetization, or customer service. You can also use the insights to validate or invalidate your assumptions or hypotheses about your app or users. You can also use the insights to set new goals or KPIs for your app or business. 

Mobile app analytics are often business-critical for any business that wants to succeed in the competitive and dynamic mobile market. By following these tips, you can effectively utilize mobile app analytics for your business and achieve your desired outcomes with your app. 

Introducing Purchase Conversion Heatmap: The Ultimate Tool for E-Commerce Optimization 

Introducing Purchase Conversion Heatmap: The Ultimate Tool for E-Commerce Optimization 

We just launched a game-changing feature designed to optimize your e-commerce site and supercharge your sales. Say goodbye to guesswork and hello to data-driven insights that will revolutionize the way you understand customer interactions. With Conversion Heatmaps, you’ll gain specific and powerful data on conversions for each element of your website.

What is Conversion Heatmap?

Heatmaps show which portions of the website are getting more traction than others, but Conversion Heatmaps show which elements drive purchase conversions. This allows for a closer look at what website elements are producing the most value for the website owner. Below you’ll see a product with a 2.4% conversion rate based on the sessions interacted from that specific element on the page.

Viewing Conversion Map 

Here’s how it works: first, make sure that the Clarity tracking code is installed on all pages of your Shopify site. Then, log into Clarity, navigate to the Heatmaps tab, and hit the Conversion Heatmaps icon (1)! Pick a page and view the heatmap overlaid onto it. You’ll be able to view the conversion rate as a percentage (2) of all sessions that resulted in a purchase when a user clicks in a selected area. 

Editing Conversion Map 

Want even more control over your data? No problem! With our Edit Areas (3) function, you can select new regions on the maps or remove existing ones with just a few clicks. And if you want to see recordings of where users clicked an element, simply select “View Recordings (4).” Getting valuable insights into your e-commerce site’s performance has never been easier. 

How to use Heatmaps and Conversion Heatmaps together

If you’ve used click heatmaps and scroll heatmaps before, you know how helpful they are to understanding what your users are clicking on and how far down your page they’re viewing. By pairing this analysis with our purchase Conversion Heatmap, you can now optimize your site more strongly towards purchases. Let’s take a look at a couple examples. 

  • Your Conversion Heatmap shows very high conversion rate on a product, meaning that a customer is likely to purchase whenever they click on that product. However, from the corresponding scroll heatmap, you can see that the product is below fold—meaning your customers typically don’t even see the product unless they scroll. One change you can consider here to increase sales is moving the product higher on your page, to be visible above fold. 
  • Your Conversion Heatmap shows a very low conversion rate on an element, meaning that a customer is not likely to purchase whenever they click on that product. Additionally, from the corresponding click heatmap, you can see this same element has many clicks. This indicates the element is worth looking into, as something seems to be preventing your users who click on this element, from purchasing.
    • One scenario could be your search bar. Users interact with your search bar frequently -but if an extremely low number actually purchase, it is worth looking at corresponding recordings to confirm what’s happening. It’s possible your search algorithm is poor, leading to users not finding what they’re looking for, or your advertisements are misleading, causing users to enter with mismatched expectations. 
    • Another scenario could be your “Add to cart” button. Users select that button frequently, but if there is an extremely low purchase rate from those users, something could be causing friction in the purchasing funnel. This could be anything from a confusing checkout process, pricing, or shipping discrepancies.

Don’t let the potential of your e-commerce site go untapped. Harness the power of Microsoft Clarity’s Conversion Heatmap feature and unlock the secrets to optimizing your online business. Start making data-driven decisions and watch as your sales soar to new heights. The future of e-commerce success is at your fingertips.

Final Thoughts

Want to learn more about Conversion Heatmaps? Check out the documentation here!

We’d love to hear how you use Conversion Heatmaps; let us know at: claritycasestudies@microsoft.com.

 Find actionable insights quicker with new filter improvements 

 Find actionable insights quicker with new filter improvements 

Time is the most valuable asset for us all. Here at Microsoft Clarity, we wanted to streamline and simplify the way use Clarity for your behavioral analytics. We know how hard it is to filter through tons of website pages to find actionable data to act upon. That’s why we improved user experience by giving the ability to exclude certain attributes, AND/OR support, and enhancing URL path filtering to give back a little extra time.  

In the past, the search bar utilized regular expressions (regex) for searching specific URL paths, which could be challenging for those without a technical background. However, with this new update, Microsoft Clarity listened to user feedback and has switched to a more user-friendly approach. 

Ideas on how to use URL filters

Here are a few ideas of what you can accomplish with the improved URL filters: 

1. Filter your high-converting pages to determine what type of traffic, features, or UX design is attributing to your success.  

2. Pinpoint URLs with specific categories to take a granular look. 

3. If you already have an optimized page, you can exclude it to focus on the pages that need extra attention.  

4. Filter out admin, support, or login pages to focus on the customer-facing pages only.  

Learn the Operators

There are 7 operators in the updated filter with different purposes to enhance your data analytics experience. The following operators include: 

  • Is exactly (default) 
  • Starts with 
  • Ends with 
  • Contains 
  • Excludes 
  • Is exactly 
  • Is exactly not 
  • Matches regex  

There are many more use cases for these operators to enhance your filtering. If you want to learn how these operators work in more depth, check it out here.

In addition to the URL filters, we understand that some traffic is more important than others. That’s why exclusions were created to pinpoint the data that matters the most. For example, if you have traffic coming from multiple countries, you might want to exclude one so you don’t ship your products to them. That way, you can focus on the data that has an impact on your bottom line.  

We also created AND/OR support to help streamline Javascript debugging for software engineers.  

When looking at the difference between AND/OR filters, you can see a big change between the sessions, which allows you to pinpoint what exactly is the root cause of your Javascript error.  

OR STATEMENT 

AND STATEMENT 

Here at Clarity, we want to make your behavioral analytics experience as simple as possible, and with these changes, we did just that. 

Give it a try, and if you use the Clarity URL Path Filters regularly, email us your story at claritycasestudies@microsoft.com. We’d love to discuss featuring you in an upcoming customer case study! 

Unveiling the Market Research Mystery: Unleash Your Inner Sherlock Holmes

Unveiling the Market Research Mystery: Unleash Your Inner Sherlock Holmes

Welcome, fellow curious minds, to the thrilling world of market research! Picture yourself as a witty detective, equipped with a magnifying glass, a keen eye for clues, and a knack for unraveling mysteries. But wait…instead of tracking down criminals, we’re going to investigate the secrets of the market. Prepare yourself for an adventure that blends Sherlock Holmes’ analytical prowess with a dash of comedy, as we embark on a journey to decode the enigmatic realm of market research. So put on your detective hat, sharpen your wit, and let’s discover how market research can turn you into the Sherlock Holmes of business decision-making!

Part 1: The Art of Observation

Just as Sherlock Holmes meticulously observes his surroundings, market research begins with keen observation. You’ll pay attention to consumer behavior, market trends, and industry dynamics, taking note of every detail. Like Holmes, you’ll identify patterns, anomalies, and hidden connections that can unlock valuable insights. It’s the power of observation that allows you to understand the needs, desires, and pain points of your target audience, enabling you to develop products or services that truly resonate with them.

Part 2: Gathering Clues

No mystery is solved without gathering clues, and in market research, data is your ammunition. You’ll employ various methods such as surveys, interviews, and focus groups to collect data from your audience. These clues are scattered throughout the market, waiting to be discovered. Just as Holmes would never underestimate the significance of a seemingly insignificant detail, you’ll carefully gather and analyze data to uncover meaningful insights. Remember, even the tiniest clue can lead to a breakthrough in understanding consumer preferences and market opportunities.

Part 3: Deductive Reasoning

Sherlock Holmes is renowned for his impeccable deductive reasoning, and as a market researcher, you’ll follow suit. Armed with data and insights, you’ll draw logical conclusions that drive your business strategies. Just as Holmes pieces together fragments of information to solve a case, you’ll connect the dots of consumer behavior, market trends, and competitor actions to make informed decisions. Your deductive reasoning will guide you in understanding market dynamics, anticipating trends, and staying one step ahead of your competitors.

Part 4: Solving the Market Mystery

In the grand finale, it is time to solve the market mystery. You’ll have a clear understanding of your target audience, armed with insights into their preferences and needs. You’ll have identified market opportunities, having dissected the market landscape for untapped potential. With your deductive reasoning and analytical prowess, you’ll develop marketing strategies that speak directly to your audience and position your brand as a true detective of their desires.

Now that you’ve done all the hard work and research you’ll need to better understand your customers on your website. With Microsoft Clarity, you’ll get a deep dive into how your customers perform actions on your website with behavioral analytics. You’ll use features such as heatmaps, session recordings, and user insights to optimize your website performance.

Conclusion:

As we wrap up our exciting journey through the world of market research, it’s evident that the Sherlock Holmes metaphor brings the process to life. By donning the detective’s hat, you’ll become an astute observer, an avid clue-gatherer, and a master of market research. The market will become your crime scene, filled with clues waiting to be uncovered.

So, embrace your inner Sherlock Holmes and venture into the realm of market research. Let curiosity be your guide as you unlock the mysteries of consumer behavior, discover hidden market opportunities, and make strategic decisions that propel your business forward. Remember, your success lies in your ability to observe, gather clues, reason logically, and solve the market research mystery.

How to Use Clarity’s Visitor Profiles to Understand Your Website Users 

How to Use Clarity’s Visitor Profiles to Understand Your Website Users 

Do you want to know more about who is visiting your website and what they do on it?  

If so, you will love Clarity’s new feature: Visitor Profiles. 

Visitor Profiles

Visitor Profiles let you see all the information you have about a visitor in one place. You can see a comprehensive summary of every visitor’s site journey, such as their browser, location, UTM source and key metrics like total time on site, average session duration and more. You can also watch recordings of their sessions and see how they behave on your site. This can help you understand their needs, preferences, and pain points better.  

A common use case is to segment your audience by their behavior or to drill down into an individual’s profile to see their web activity and key events during sessions. You can also see metadata associated with their sessions such as session duration, device or referral source. 

This blog post provides all the information you need to become an expert at using Visitor Profiles. Let’s start by looking at where you can find information for all your visitors – in the dashboard. 

1. Analyzing visitor loyalty on the dashboard 

This dashboard shows a comprehensive summary of the number of customers that are currently on the site along with the total users during the selected time frame (1). Additionally, it also allows you to examine the visitors with the most sessions on your website(2).  


You can click on the “Profile” (3) button to view that visitor’s profile, which shows you the visitor profile view; more of this will be covered in the next section.

2. Inside Visitor Profile

You’ll find a high-level summary of the user on the left-hand side of this view (4). This includes metadata you’ve collected like the visitor’s Clarity ID, last location, last UTM source, medium & campaign.  

Additionally, you also see unique visitor metrics like total time spent on your site, total number of sessions and average session duration. In this instance, this person came to your site 48 times within the selected date range (5).

On the right-hand side of the view, show the summary of all sessions for the given visitor on your site (6). Each row shares some basic information about the session, key events that happened in a session and has a play button  to begin watching the playback (7)

3. Link your users to Visitor Profiles in Clarity 

Clarity assigns a unique ID to each new visitor on your website. This Clarity ID is anonymous and lets you track their sessions. To better align these anonymous profiles with your user information, use the Identify API. You can pass in a custom user ID which can then be used as a filter in Clarity. 

Learn more about how Clarity handles custom IDs here: Identify API | Microsoft Learn 

Ways to use Visitor Profiles for your scenarios: 

  1. If you find an interesting user session, get a high-level summary of this user via Visitor Profiles
    • Go to “More details” – Click on Clarity ID or Custom ID 
  2. Analyze visitors from different angles with 25+ different filters 
    • Analyze visitors from different campaigns
    • Analyze visitors from different traffic source 
    • Analyze visitors from different pages 
  3. Deep dive into a customer service issue by searching for a visitor by their custom ID.

Clarity’s Visitor Profiles feature provides a comprehensive view of your website visitors, allowing you to see a high-level summary of the user. With Visitor Profiles, you can access key metrics, events, watch session recordings, and understand visitor needs. By linking your users to Clarity using the Identify API, you can enhance Visitor Profiles and analyze data more effectively. Leveraging Visitor Profiles helps optimize website performance, personalize experiences, and make informed decisions for online improvement.

Understanding User Personas: Crafting a User-Centric Experience

Understanding User Personas: Crafting a User-Centric Experience


In today’s digital age, creating a user-centric experience is paramount for businesses seeking to thrive in a competitive landscape. User personas play a crucial role in this endeavor, helping us gain deep insights into the needs, goals, and behaviors of our target audience. By understanding user personas, businesses can tailor their products, services, and marketing strategies to meet the specific demands of their customers. In this blog post, we will explore the concept of user personas, their significance, and provide you with practical tips on how to create effective user personas for your business.

What Are User Personas?

User personas, also known as buyer personas or customer profiles, are fictional representations of your target audience segments. These personas are created based on extensive research and data analysis to encapsulate the characteristics, motivations, and goals of your typical customers. By personifying your target audience, you can better understand their needs, preferences, pain points, and behaviors, allowing you to make informed decisions when designing products, improving user experiences, and formulating marketing strategies.

The Significance of User Personas:

  1. Enhanced User Understanding: User personas provide a holistic view of your target audience, enabling you to empathize with their needs and goals. This understanding helps you design intuitive and engaging user experiences that cater to their expectations.
  2. Effective Communication: User personas serve as a communication tool within your organization. They allow teams across departments, such as product development, marketing, and customer support, to align their efforts and work towards a unified goal of satisfying the identified user needs.
  3. Tailored Marketing Strategies: With user personas, you can develop personalized marketing campaigns that resonate with specific customer segments. By tailoring your messaging and content to match their preferences and pain points, you can increase engagement and conversion rates.
  4. Improved Product Development: User personas guide product development by highlighting the features, functionalities, and user flows that will appeal to your target audience. By incorporating user preferences into the design process, you can create products that meet their expectations and solve their problems effectively.

Creating Effective User Personas:

  1. Conduct Research: Start by gathering qualitative and quantitative data through surveys, interviews, user testing, and analytics. Explore demographics, psychographics, motivations, goals, pain points, and behaviors of your target audience to gain valuable insights.
  2. Identify Patterns: Analyze the collected data to identify commonalities, patterns, and trends among your users. Look for shared characteristics, preferences, and needs that can be grouped together to form distinct user personas.
  3. Define Personas: Based on your analysis, create fictional characters that represent each user persona. Give them names, job titles, backgrounds, and specific details that align with their needs, goals, and pain points. Ensure your personas are realistic and relatable.
  4. Empathy and User Journey Mapping: Step into the shoes of your personas and map their journey with your product or service. Identify touchpoints, pain points, and opportunities for improvement throughout their interaction with your brand.
  5. Continuous Iteration: User personas should be dynamic and adaptable. Regularly update and refine your personas as you gather new insights and as your target audience evolves over time.

Example User Persona

Sarah Thompson – The Tech-Savvy Professional

Name: Sarah Thompson Age: 32 Occupation: Digital Marketing Manager Background: Sarah is a tech-savvy professional with a passion for digital marketing. She has been working in the industry for over seven years and is constantly seeking innovative tools and solutions to stay ahead of the competition. Sarah holds a Bachelor’s degree in Marketing and is always eager to learn about the latest industry trends.

Goals and Motivations:

  1. Stay Updated: Sarah’s primary goal is to stay updated with the latest digital marketing trends, tools, and strategies to improve her skills and deliver successful campaigns for her clients.
  2. Increase Conversion Rates: Sarah aims to optimize conversion rates for the marketing campaigns she manages. She is motivated by achieving higher ROI and generating substantial revenue for her clients.
  3. Enhance Efficiency: Sarah is constantly looking for ways to streamline her workflow and improve efficiency. She seeks tools that can automate repetitive tasks, provide insightful analytics, and offer seamless integrations.

Pain Points:

  1. Information Overload: With the abundance of digital marketing resources available, Sarah often finds it challenging to filter through the noise and identify the most relevant and trustworthy sources.
  2. Time Constraints: As a busy professional, Sarah has limited time to explore new tools and strategies thoroughly. She seeks solutions that are easy to understand, implement, and integrate into her existing workflow.
  3. Technical Support: When encountering technical issues or hurdles while using new tools, Sarah values prompt and reliable customer support to resolve problems efficiently.

Behaviors:

  1. Continuous Learning: Sarah regularly participates in webinars, attends industry conferences, and reads industry blogs to expand her knowledge and stay updated with the latest digital marketing trends.
  2. Active Networker: Sarah actively engages with online communities, forums, and social media groups to exchange insights, best practices, and recommendations with fellow professionals in the field.
  3. Early Adopter: Sarah enjoys being an early adopter of new tools and technologies that show promise in improving her productivity and campaign performance. She actively seeks recommendations and reads reviews before making a purchase or integrating a new solution into her workflow.

By understanding user personas like Sarah Thompson, businesses can design marketing campaigns and develop products that cater to the specific needs and preferences of their target audience. Remember, user personas should be customized to your business and continuously updated as you gather new insights and trends in your industry. In addition, you can use Microsoft Clarity to visualize your user’s behaviors through heatmaps and session recordings. This will give you a more complete picture of how effective your initial analysis is.

Conclusion:
User personas are invaluable tools that allow businesses to truly understand their customers and tailor their products, services, and marketing efforts to meet their needs. By investing time and effort into creating accurate and comprehensive user personas, you can create remarkable user experiences, foster customer loyalty, and achieve business success. Remember, the key to effective user personas lies in ongoing research, empathy, and a commitment to continuously optimizing your understanding of your target audience.

Unlocking the Power of Psychographics in Marketing: A Deep Dive into Understanding Your Customers’ Values, Attitudes, and Behaviors

Unlocking the Power of Psychographics in Marketing: A Deep Dive into Understanding Your Customers’ Values, Attitudes, and Behaviors

In today’s crowded marketplace, it’s not enough to simply advertise your product or service to a broad audience and hope for the best. You need to understand your customers at a much deeper level to connect with them and stand out from the competition truly. This is where psychographics comes in, a framework that helps businesses gain insights into their target audience’s values, beliefs, and behaviors. Businesses can create personalized and targeted campaigns that capture attention and drive action by tapping into the psychology behind their customers’ decision-making. In this blog, we’ll take a deep dive into the exciting world of psychographics in marketing, exploring its impact, benefits, and practical applications. Get ready to discover a new way of understanding your customers and transforming your marketing strategy!

At its core, psychographics is the study of a particular group’s personality, values, attitudes, interests, and lifestyles. Unlike demographics, which focus on statistical characteristics like age, gender, income, and education, psychographics provides a more nuanced understanding of what motivates people to make certain decisions. By using psychographic research methods, such as surveys, interviews, and focus groups, marketers can develop a deep understanding of their target audience’s mindset, preferences, and behaviors. This knowledge can then be used to create highly targeted marketing campaigns that speak directly to the desires and needs of their customers. The result is a more effective marketing strategy that generates better engagement, conversions, and long-term customer loyalty.

5 Examples of psychographic characteristics

Psychographic characteristics are personal traits that drive behavior and decision-making. Here are five common examples that businesses use to understand their target audience.

1. Values: the beliefs and principles that guide a person’s behavior and decision-making. For example, a person who places a high value on environmental sustainability may be more likely to purchase products from eco-friendly brands.

2. Attitudes: a person’s general evaluation or feelings towards something, such as a product or service. For instance, someone with a positive attitude toward technology may be more likely to purchase the latest gadgets and software.

3. Interests: activities or topics a person enjoys or finds engaging. For example, someone who enjoys outdoor activities may be more receptive to camping or hiking gear advertisements.

4. Personality: traits are enduring characteristics that influence a person’s behavior and attitudes. Marketers may use personality traits such as extroversion, openness, or conscientiousness to tailor their marketing messages to specific segments of their target audience.

5. Lifestyle: a person’s lifestyle refers to habits, behaviors, and routines. For example, a busy professional who values convenience and time-saving solutions may be more likely to use online shopping services and meal delivery kits.

5 Psychographic examples that can help your marketing strategy

Psychographic characteristics such as values, interests, attitudes, and lifestyles can significantly shape buying behavior. By understanding these characteristics, businesses can create targeted marketing campaigns that resonate with their customers on a deeper level. To measure how effective your marketing is and see how users really interact with your website, you can use Microsoft Clarity to view heatmaps and session recordings to get a better understanding of their behavior. Here are five common psychographic examples that businesses can use to create effective marketing strategies.

1. Brand Loyalty: customers can be deeply loyal to specific brands and will continue to purchase products from those brands regardless of price or convenience.

2. Social Status: people may buy certain products to elevate their social status or fit in with a certain group.

3. Health Consciousness: customers may be more inclined to purchase healthy or organic products, and are willing to pay more for products that align with their health-conscious lifestyle.

4. Environmentalism: customers who are environmentally conscious may be more likely to purchase products from eco-friendly brands or those that promote sustainability.

5. Convenience: customers may prioritize convenience over price or other factors and are likely to purchase products that make their lives easier or save them time.

Example of how to use psychographics in a marketing strategy

Let’s say we have a business that sells organic, healthy snacks. Using the psychographic characteristic of health consciousness, we can create a targeted marketing strategy to attract customers who prioritize healthy living. Here’s an example:

1. Identify the target audience: The target audience for this campaign would be health-conscious individuals who prioritize organic and healthy food options.

2. Create targeted messaging: The messaging should focus on the health benefits of the products, the use of organic and natural ingredients, and the company’s commitment to sustainability.

3. Leverage influencers: Partner with health and wellness influencers to promote the products and share their experiences with their followers.

4. Use social media: Create targeted social media campaigns focusing on health and wellness, and use hashtags related to healthy living and organic food.

5. Attend health and wellness events: Attend local health and wellness events and offer samples of the products, along with information about their health benefits and the company’s commitment to sustainability.

Using the psychographic characteristic of health consciousness and creating a targeted marketing strategy, this business can attract customers who prioritize healthy living and organic food options.

Understanding your target audience is essential for any successful marketing strategy. Psychographics offers a powerful framework for businesses to gain deeper insights into the values, beliefs, and behaviors of their customers. By tapping into the psychology behind their customers’ decision-making, businesses can create highly targeted and personalized campaigns that speak directly to their audience’s desires and needs. With psychographic research methods such as surveys, interviews, and focus groups, businesses can develop a deep understanding of their target audience’s mindset, preferences, and behaviors.

Microsoft Clarity for Mobile Apps is Here!

Microsoft Clarity for Mobile Apps is Here!

You asked. We listened!

The first release of Microsoft Clarity for Mobile Apps is now available. You can unlock user behavior insights for your mobile apps with the simple experience you are used to with Clarity Web and for the same price, Free!

All you have to do is signup for clarity (if you don’t already have an account), create a mobile project, and then follow the installation steps! Curious about what the Clarity app experience looks like, check out our live demo.

Clarity for mobile apps features

Dashboard & Insights

You will be able to see an at-a-glance overview of your users’ behavior.  User friction indicators, like rage, application crashes, and dead taps, will give you vital insight into which parts of your app require your attention.

Recordings

Session replay is a reconstructed experience of how your users experience your app. It shows events like taps, movements, and scrolls. This happens in the form of a reconstructed walkthrough-style video.  Session replay helps you understand your users’ experiences like never before.

Heatmaps

Gain insights across potentially thousands of sessions on the general usage trends within your app screens.  The taps heatmap aggregates tap and user interactions across all user sessions, showing how most users interact with your app.  It will help you dig deeper into pivotal aspects of your experience and understand where the action is!

Built around user needs

Will the Clarity mobile SDK still support my app even if it has webviews?”

Clarity mobile SDK provides an integrated experience across native and web components within your app, so you can experience everything seamlessly on the same canvas.  It also provides a high level of granularity and flexibility to control masking elements across webviews and the native components.

Will Clarity Mobile SDK slow down my app“? 

We know that for app developers, performance is top of mind.  The Microsoft Clarity SDK has been designed to minimize the impact on mobile performance with its unique screen re-drawing approach.  Our SDK captures low-level drawing operations instead of videos/screenshots lending itself to a highly optimized experience.

It’s just the beginning…

This release is the first step in a long journey to bring all that you love about Clarity to mobile apps! For now, our SDK supports native Android, React Native, Cordova & Ionic.  We will keep adding features and continuously adapting our capabilities to support popular frameworks and technologies.

How to get started 

Sounds exciting?  Here’s how to start using Clarity’s Mobile SDK:

  1. Signup for Clarity (If you already don’t have an account)
  2. Create a Mobile Project
  3. Follow the Integration Steps

Tell us how it worked for you! 

We are super excited about our Clarity for Mobile Apps release.  We will continue to launch new features and make improvements, including supporting iOS in the future. 

Give it a try and email us your suggestions/ Inquiries at clarityms@microsoft.com.  We’d love to hear your feedback as we continue to build the product around you!

Bots vs. Real Users: Who is really visiting your site?

Bots vs. Real Users: Who is really visiting your site?

Your site visitor may not be who you think they are. Did you know that for some sites, bots – automated visits – can be up to 50% of a website’s total traffic? With the new advancements in automation and artificial intelligence, bot traffic is becoming even more omnipresent.  

In this blog post, we’ll dive into what bot traffic is and how you can make sure you know what real users, not bots, are doing on your site.  

What is bot traffic?  

Bot traffic refers to automated visits to a website. Bots come from various sources such as search engines, social media platforms, and other individuals or websites. For example, search engines use bots to crawl and index websites for search ranking. Some bots may be beneficial to your website, while others can be malicious and cause harm by slowing down your site’s performance. 

How does bot traffic affect my website analytics data? 

When bots visit your site, they generate fake automated sessions that can skew your metrics like page views, bounce rate, time on site and conversion rates. For example, if a bot visits your site and generates hundreds of page views in just a few seconds, it could artificially lower your average time on site or increase pages per session.   

Bots can lead to misleading conclusions about your user experience—like the bot example above that might make you think your time on site has gone down.  As a result, these bot sessions can lead you astray, by hiding the impact of changes you make or by leading you to invest in features that don’t matter to your real users and business goals.  

What can I do about bots?

To optimize your website effectively, focus on your real users: Make sure that you detect bot traffic and filter it out from your analytics tools.  

When Clarity’s bot detection is turned on, the dashboard displays the count of bot sessions. Clarity also filters out bot traffic from your dashboard, heatmaps, and session recording. That way you can see exactly how real users are interacting with your site. This enables you to identify areas for improvement that will genuinely benefit users, such as slow-loading pages or confusing navigation. 

While Clarity’s bot detection is on by default, you have complete control over how bot traffic is handled in your analytics data: you can also turn bot detection off or back on again. When bot detection is turned off, Clarity can neither detect bot traffic nor exclude it from your data. This may be useful if you want a more comprehensive view of all sessions on your site, including both human and bot traffic. However, it’s important to keep in mind that this may result in distorted analytics data, due to the inclusion of bot behavior. 

Sum it up for me! 

Detecting bot traffic is crucial for optimizing a website because it affects the accuracy of your analytics data. By using Clarity’s bot features, site owners can filter out bot traffic to get an accurate picture of how real users are interacting with their sites. Whether you’re just starting out with website optimization or looking to take your efforts to the next level, Clarity’s bot features are a valuable tool in your arsenal. So why wait? Start using Clarity today and start optimizing your website for real users! 

Get Your Weekly Update: Introducing Clarity Weekly Digest

Get Your Weekly Update: Introducing Clarity Weekly Digest

In today’s fast-paced world, it can be difficult to keep track of all the projects you’re working on. That’s why we’ve created a feature that sends out weekly emails with a summary of your project progress.

Clarity weekly digest which provides a summary of key metrics about user sessions on your website. The emails include frustration metrics such as rage clicks, dead clicks, JS errors, and quick backs. These metrics can help you understand where users are encountering problems and what may be causing them to leave your site prematurely. 

In addition, the email also provides sample sessions for the week so you can see exactly how users are interacting with your site and identify any pain points they may be experiencing. Understanding this information will allow you to optimize your website by making changes that align with the needs of your audience, resulting in a better user experience for everyone involved. 

 Clarity Digest Module

Finally, our weekly email digest also provides high-level metrics like total sessions, average pages per session and average scroll depth. These metrics give you an overview of how well your website is performing overall and can help you identify areas that need improvement. For example, if the average pages per session are low, it may be time to make changes to keep users engaged and, on your site, longer. 

Joining our Weekly Email Digest is effortless 

To join, log into your Clarity account and head to the “Manage Account” option located on the upper right corner of your screen. A list of account settings will then be displayed, including a “Subscribe” button towards the bottom that you just need to click on to start receiving our insightful reports each week. Don’t worry, if at any point you want to unsubscribe, simply follow these same steps.

Give it a try, and if you use the Clarity weekly email report regularly, email us your story at claritycasestudies@microsoft.com. We’d love to discuss featuring you in an upcoming customer case study!

Android Mobile SDK

Android Mobile SDK

With a majority of mobile usage being through apps, it’s crucial to ensure a high-quality in-app experience because it can significantly impact user retention. That makes the use of analytics to optimize app experiences to achieve maximum engagement and customer satisfaction extremely important.

It’s no wonder that mobile apps have taken the world by storm and that they shifted how the internet works.  In fact, 43% of all internet e-commerce traffic comes from apps.  We at Microsoft always put our customers first and we always go where our customers are.

That’s why we are announcing the availability of the beta version of Microsoft Clarity for Android Apps!  Now you can unlock user behavior insights for your Android mobile apps all with the simple experience you are used to with Clarity Web and for the same price, Free!

All you have to do is signup for clarity (if you don’t already have an account), create a mobile project, and then follow the installation steps!

What you’ll find in Clarity for mobile apps

Dashboard & Insights: 

You will be able to see an at-a-glance overview of the behavior of your users.  User friction indicators like rage and dead taps will give you a strong insight into which parts of your app require your attention.  This will also help you uncover bugs and issues lurking within your UI.  Finally, you can segment and filter users on different dimensions including phone model, operating system, and much more! 

Recordings: 

Session replay is a reconstructed experience of how your users experience your app.  It shows events like taps, movements, and scrolls.  This happens in the form of a reconstructed walkthrough-style video.  Session Recordings help you understand your users’ experiences like never before. 

Heatmaps: 

Gain insights across potentially thousands of sessions on the general usage trends within your app screens.  Tap heatmaps is an aggregation of taps and user interactions across all user sessions. This shows you how the majority of users interact with your app.  This will help you dig deeper into pivotal aspects of your experience and understand where the action is! 

Built around user needs 

A question that we commonly got from our group of early users is that  “Will the Clarity mobile SDK still support my app even if it has webviews?” The answer is “Yes”.  Clarity mobile SDK provides an integrated experience across native and web components within your app, so you can experience everything seamlessly on the same canvas.  It also provides a high level of granularity and flexibility to control masking elements across webviews and the native components.  

And also we often got this question: “Will Clarity Mobile SDK slow down my app“?  We know that for app developers, performance is top of mind.  The Microsoft Clarity SDK has been designed to minimize the impact on mobile performance with its unique screen re-drawing approach.  Our SDK captures low-level drawing operations instead of videos/screenshots lending itself to a highly optimized experience.  

It’s just the beginning….. 

This release is the first step in a long journey to bring all that you love about Clarity to mobile apps!  For now, our SDK supports native Android, React Native, and Cordova.  We will keep adding features and continuously adapting our capabilities to support popular frameworks and technologies.  

How to get started 

Sounds exciting?  Here’s how to test Clarity’s Mobile SDK, Just Sign up for our waitlist

Tell Us How it worked for you! 

We are super excited about our Clarity Mobile SDK.  We will continue launching new features that will provide value to our users at the existing price of, Free.  

Give it a try, and email us your suggestions/ Inquiries at clarity-apps@microsoft.com.  We’d love to hear your feedback as we continue to build the product around you! 

View Clarity insights inside WordPress

View Clarity insights inside WordPress

WordPress is a user-friendly, open-source platform that empowers individuals and businesses to easily create and manage their own websites, offering full control over design, content, and data. It enables users to effectively showcase their unique brand and share their story with the world. Developed and maintained by a dedicated community of experienced contributors, WordPress offers an extensive library of over 55,000 plugins, providing users with all the tools and resources they need to create and optimize their websites. With our existing success with the Microsoft Clarity plugin for WordPress, we decided to take a step further and let you see Microsoft Clarity insights inside your WordPress dashboard.

One of the key benefits of embedding Microsoft Clarity into WordPress is the seamless integration of Clarity’s analytics directly into the WordPress interface. This allows users to easily access and view Clarity insights without having to navigate away from their WordPress dashboard. The embedded view allows users to quickly and easily understand how their website is performing, and make data-driven decisions to optimize their site for better user experience and conversions. The insights provided by Clarity can be used to track user behavior, identify areas of improvement, and measure the effectiveness of changes made to the site. With Clarity embedded in WordPress, website optimization has never been more convenient.

All you have to do is to install the Clarity plugin on your WordPress account and sign up easily from WordPress with your Microsoft, Google, or Facebook account, and start creating your Clarity projects. If you have existing Clarity projects, you can easily connect them to your WordPress site and start seeing insights on the dashboard immediately embedded in your WordPress account.

Here’s how to get started:

Step 1:

Search for Clarity in your WordPress plugin.

Step 2:

From the navigation menu, open Clarity and Sign-in/Sign-Up to Microsoft Clarity to connect existing projects or create a new project from the embedded view.  Clarity insights and dashboard will appear embedded in your WordPress account. 

For a more detailed look into your insights, you will be redirected from WordPress to view your heatmaps and session recordings inside Clarity.

Now that you’ve set up your Clarity account within WordPress, you’re ready to start gaining valuable insights into your website’s performance. The integration of Clarity into WordPress allows you to easily track and analyze user behavior, giving you the tools you need to optimize your site for better user experience and conversions. With the ability to view Clarity insights directly within the WordPress interface, you can make data-driven decisions quickly and easily. Whether you’re a small business owner, blogger, or marketer, the integration of Clarity into WordPress streamlines the process of gaining valuable insights into your website’s performance and allows you to focus on growing your brand and sharing your story. Start utilizing the power of Clarity today and take your website to the next level.

Give it a try, and if you use the Clarity view in WordPress regularly, email us your story at claritycasestudies@microsoft.com. We’d love to discuss featuring you in an upcoming customer case study!