Session recordings are user session replays that are created when visitors interact with your website. They are very useful in analyzing user experience and/or behavior across multiple devices! To enhance this feature even more Clarity customers can now favorite their key recordings and as a result, view them in the favorite recordings tab! Super exciting!
Continue reading “Session Recordings saved – with Clarity favorites!”Category: Blogs
Blogs written by the Clarity staff
Clarity launches e-commerce insights for Shopify!
Wow! Our team sure has been busy over the last few weeks! Just like Pharrell and Snoop, we are dropping new features like they are hot! This week it’s an e-commerce feature that we know you will love! Introducing E-commerce insights with Clarity for Shopify websites! Shopify powers over 1.7 million websites worldwide and is the all-in-one commerce platform to start, run and grow a business. So naturally, it made sense for us to include these insights in Clarity!
Continue reading “Clarity launches e-commerce insights for Shopify!”Clarity integration now in AB Tasty!
Our team is super excited to announce the native integration of Microsoft Clarity in AB Tasty! AB Tasty enables marketing, product, and tech teams to build and release better-validated user experiences. Whilst at the same time minimizing risk and accelerating time to market!
Continue reading “Clarity integration now in AB Tasty!”Save time – Google Analytics segments now in Clarity

Clarity and Google Analytics (GA) together are the ultimate #powercouple ❤️!
Continue reading “Save time – Google Analytics segments now in Clarity”Pubcon gets Clarity

Our very own Sharon Peng delivered an outstanding Clarity keynote session to the SEO and marketing world at Pubcon!
Continue reading “Pubcon gets Clarity”Give Google Analytics a boost with Clarity
You use Google Analytics because it gives you tools for slicing and dicing data that you need to set your strategy, define your audience, and adjust your website. However, did you know that by pairing it with Clarity you can maximize your insights?
Continue reading “Give Google Analytics a boost with Clarity”Watch what matters – with Interesting user segments
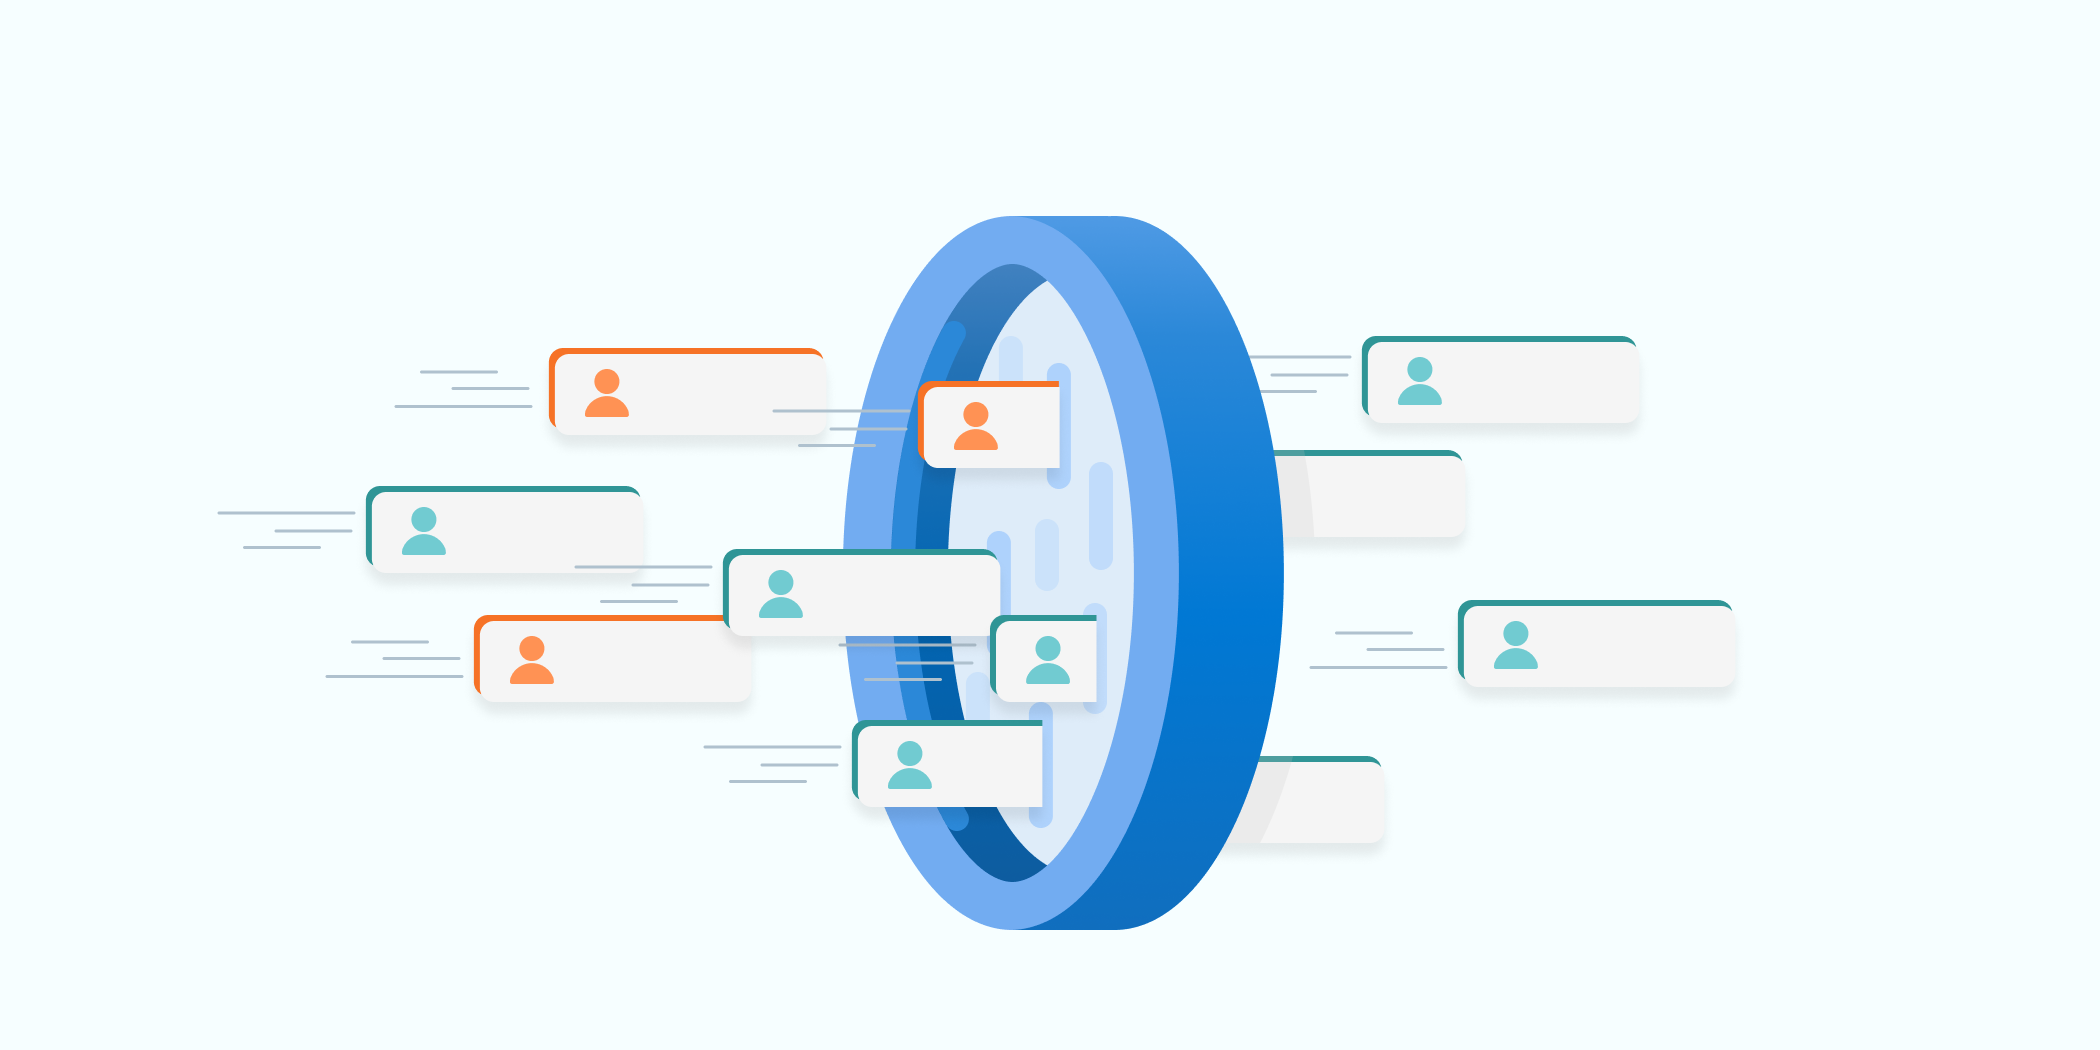
Session recordings show what your users are doing on your site. If you don’t understand your customer journeys, you are guessing ways to improve your website.
Continue reading “Watch what matters – with Interesting user segments”CTA (call-to-action): The desire to click!

Do you need more subscribers? Want to entice your visitor to purchase your product or service? Do you want to persuade your visitor to try your offering? Then you need to make sure your website has a compelling CTA!
Continue reading “CTA (call-to-action): The desire to click!”Manage and Save Your Favorite Filters with Segments
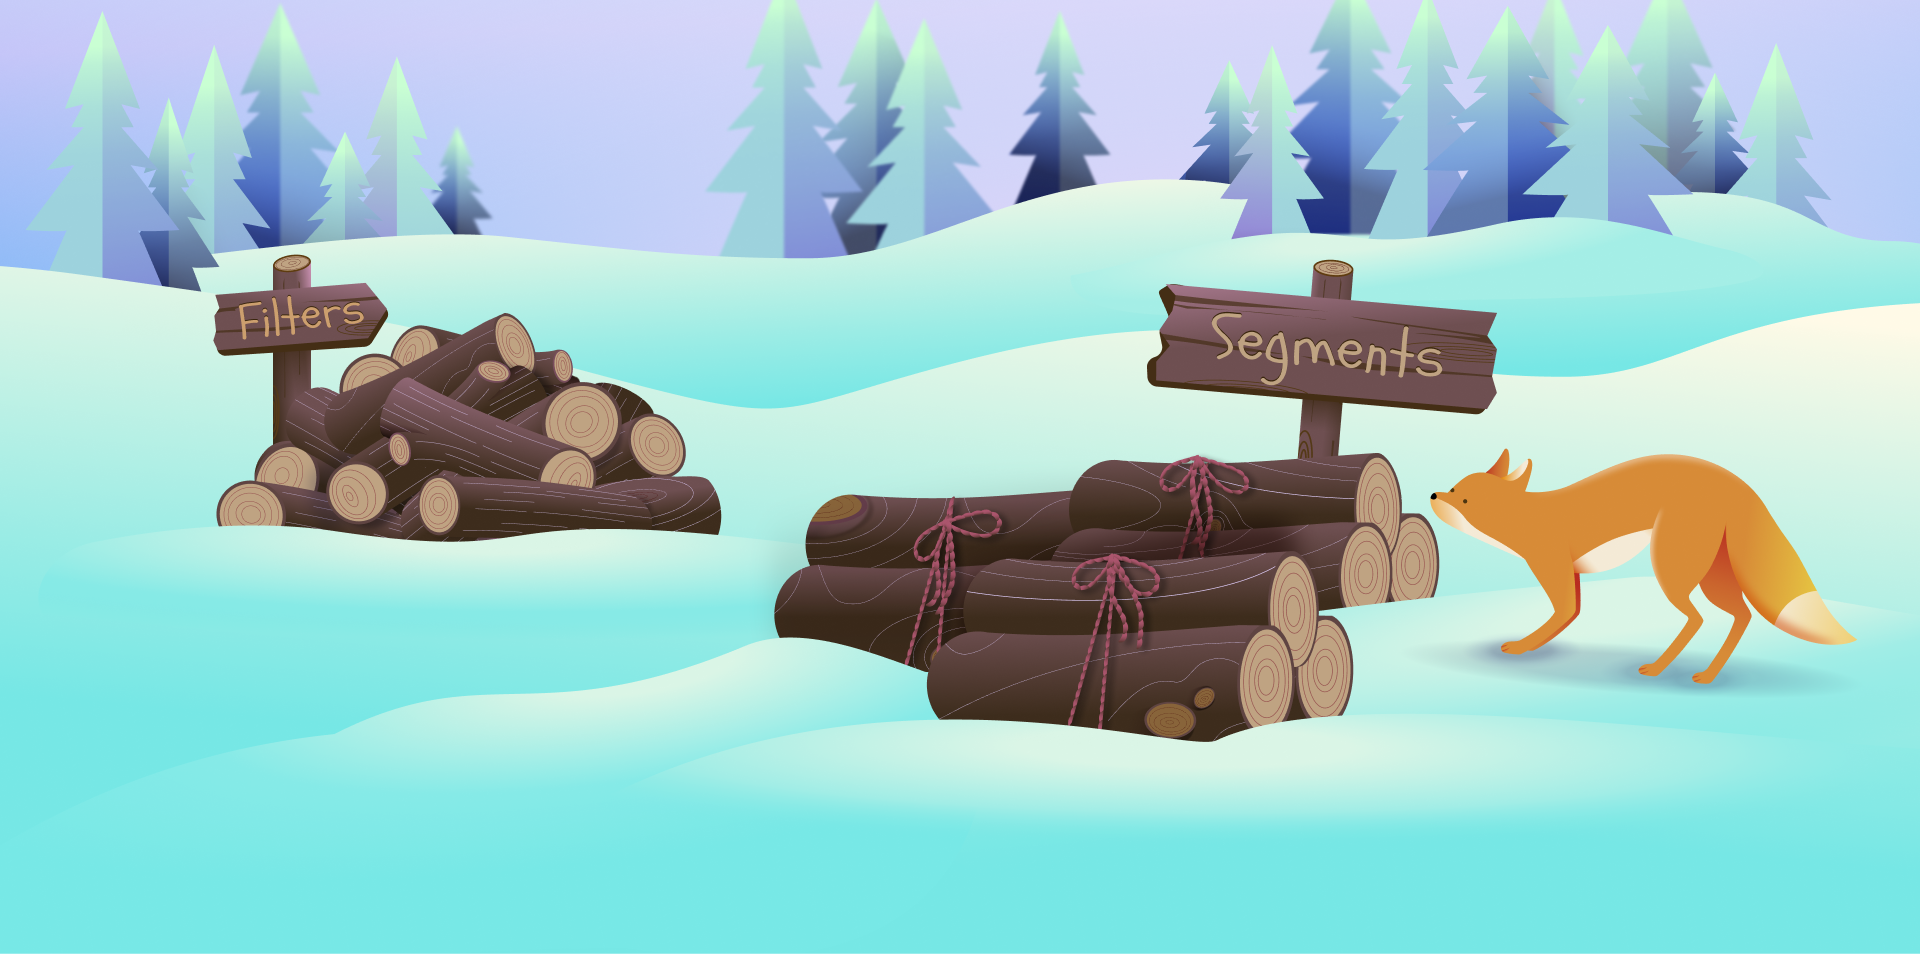
Having filters is a critical tool to sort information into actionable insight. Clarity captures so much information from so many different types of users that often you only need to analyze a specific subset of your users. With Segments you can do exactly that!
Segments allow you to group users who share common characteristics, such as device type, browser, location, or page visited. You can also create segments based on user actions, such as clicks, scrolls, mouse movements, or rage clicks.
Let’s start with the basics.
Creating Your Segment
Clarity has made it very easy to do so in just three quick steps:
- Apply your desired filters.
- Select ‘Save as Segment‘ button and give a friendly name.
- To view the Segment later, click on the ‘Segments‘ button.
Now let’s look at an example of how Segments can help you analyze the data you want to see:
Scenario: A small business owner has a website that focuses on exciting vegetarian dishes. To increase traffic to the website the owner is also posting content on the personalized recipe recommendation website, Yummly. Most of the traffic from this campaign is on mobile and the owner wants to understand the mobile experience of Yummly visitors by watching session recordings. As this is an ongoing activity, it makes sense to create a Segment for quick viewing.
The user applied the following filters to drill down for this specific data:
- Campaign: Yummly
- Device: Mobile
- Duration: Last 7 day
Select “Save as Segment” and give your segment a name that you can remember so you can easily find it to use again. You can always change the name of your segment at a later date!

Navigate to your segments tab, select the name you saved, and the filters are automatically applied every time you select it for future analysis.

Benefits of Segments
- Quickly access the Segment filters important to you
- Save as many as you want (there is no limit!)
- Segments are shared across the project to give easy access to filters your team cares about
One of the powerful features of Microsoft Clarity is the ability to create segments based on user behavior and attributes. Segments will become a key tool in optimizing the user experience for your website visitors! Start creating your favorite segments today and let us know what you think!
To learn more about Segments, click here.
Add Clarity to your site today!
Use our insights and analytics to wow your website visitors!
Filter updates: new filters & sticky functionality!
Filters are a powerful tool that allows you to drill into the detail of your data. Furthermore, they help spot interesting patterns to aid decision-making and optimizing the user experience. The Clarity team is passionate about listening to customer feedback and for this reason, we have made some exciting updates.
Continue reading “Filter updates: new filters & sticky functionality!”Rage clicks – what do they tell you about user behavior?
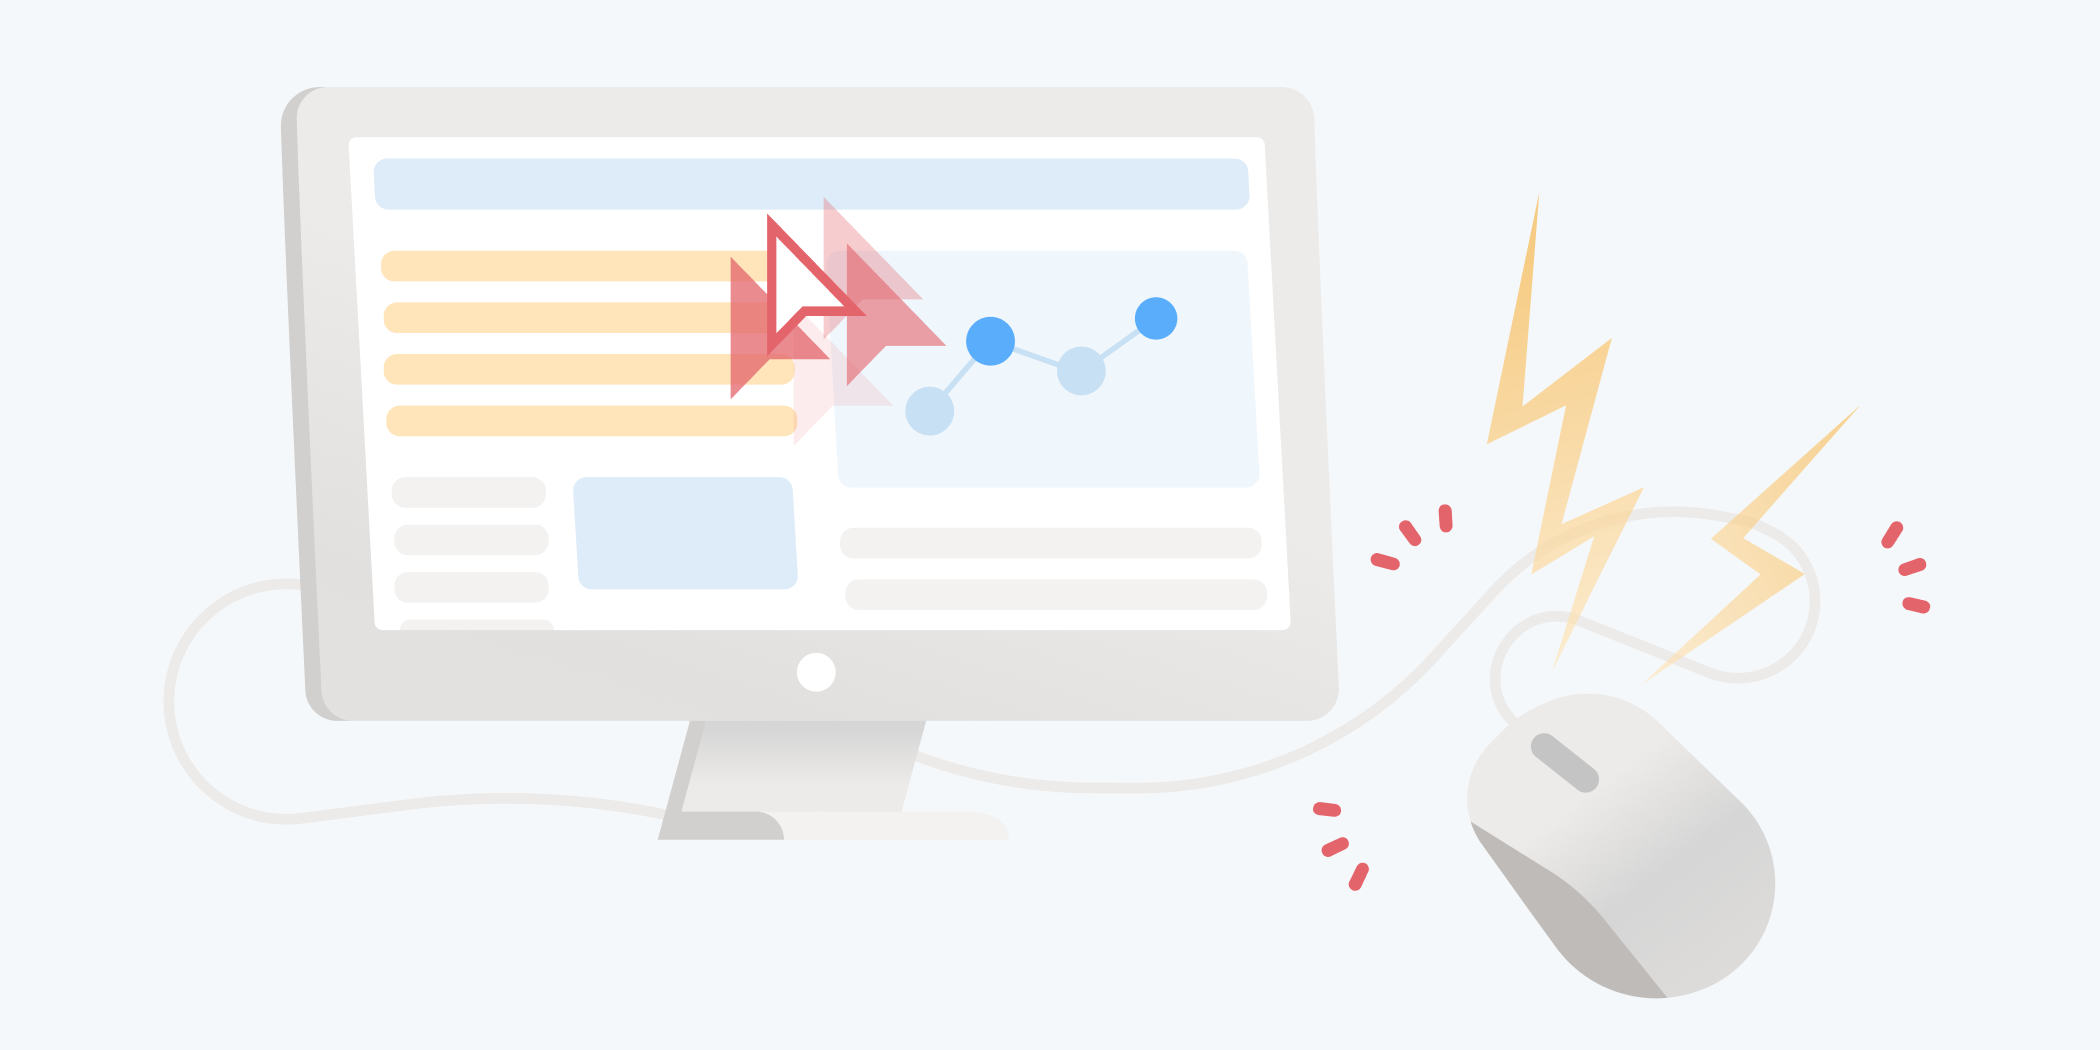
Rage clicks are repeated clicks/taps in a specific area of a webpage in a short amount of time that does not result in any change on the page. This repeated clicking could signal that the user is frustrated or an element in your site may be broken! As users we have all been there when clicking on a button, image or link does nothing. As your frustration increases so do your clicks! By understanding this user behavior, you can optimize your page for the intended call to action. The major benefit of rage click analysis is the ability to find quick wins for fixing user frustration on your site.
Continue reading “Rage clicks – what do they tell you about user behavior?”Mastering Microsoft Clarity Heatmaps: Insights and Best Practices
What is a Heatmap?
A heatmap is a way of showing aggregated data in a visual way. It uses colors to show different levels of user activity on a website, such as clicks, scrolls, mouse movements, etc. Warmer colors (reds) show higher activity while cooler colors (blues) represent lower activity. There are three main types of heatmaps within Clarity: click, scroll, and area. Each one gives a unique insight into how users behave on a website.
Click Heatmaps
Click heatmaps help you understand the critical content on the page. They allow you to identify parts of the page design where your users are clicking and help determine what users may mistake for links. On PC, Clarity tracks your user clicks and on mobile or tablet, Clarity tracks your user taps. You can also view click maps for a single page or group of pages.

Scroll Heatmaps
Scroll heatmaps indicate how far users scroll on average. This data helps determine whether your users see the most important content and indicates where to put your essential calls to action. As you hover over the Scroll map, you can view the exact % of users who reached that point of your webpage or group of pages. It displays the Average fold which indicates the average location visible on a webpage before the user starts scrolling. Scroll maps are useful for longer, text-based content. If users aren’t scrolling past the first few paragraphs, you might want to move important information higher up on the page.

Area Heatmaps
Area Maps show the number of clicks across different, editable, regions of your webpage. You can easily see the number of clicks within an area as well as the click through rate, which represents the percentage of all clicks that occurred in the area. Unlike a click map, you can choose the area and view the heat for all the elements within the area.

Across each of the heatmaps, you can toggle between the different devices that Clarity supports such as: desktops, tablets, and mobile devices.
You can also compare two heatmaps side by side. This is perfect for A/B testing, as it allows you to visually assess which design changes drive more engagement.

Another useful feature is switching screenshots. You can switch between different screenshots of the same heatmap to see how user interactions vary across different versions of your page. This feature is particularly useful for analyzing dynamic content and ensuring consistent user experience. For instance, see how a seasonal promotion affects user behavior compared to your standard layout.

How is a Heatmap Generated?
Heatmaps are generated from aggregated data, and understanding how this data is aggregated is crucial for interpreting the heatmap representation.
Traditionally, click heatmaps record the X and Y positions of mouse clicks. All clicks at those coordinates contribute to the heat intensity, which is then overlaid on a static website representation. However, this method doesn’t scale well for varying screen resolutions, dynamic HTML elements, single-page apps, or dropdown menus.
In contrast, Clarity employs an advanced process with intelligent HTML element detection based on a website’s DOM. For click maps, Clarity identifies clicks on specific tags, CSS classes, and parent nodes, aggregating them by element. This approach allows heatmaps to be drawn relative to these elements rather than X/Y coordinates. For scroll maps, Clarity considers page length and user scrolling across multiple pages.
Notably, Clarity’s heatmaps are dynamic, displaying interactions based on elements existing at different points in time. This flexibility enables visualization of clicks during various stages of a page’s existence.
5 Key Takeaways from Heatmaps
1. Heatmaps can help you measure how your visitors’ experiences change when you update your site.
Keep track of progress by comparing your visitors’ experiences on your site before and after making changes. This will help you understand the impact of your site improvements and updates.
2. Heatmaps can help you find out what content your visitors like best.
Understand your visitors’ favorite content over time so you can give them more of what they want and less of what they don’t.
3. Heatmaps can help you design better website layouts.
Design more effective website layouts by letting heatmaps tell you how each element on your page ranks in its user engagement.
4. Heatmaps can help you prioritize what to fix when you have limited resources.
Make decisions to prioritize issues that have the greatest impact on user experience and sales conversion.
5. Heatmaps can show you the results of experiments on your site.
With heatmaps, you don’t have to guess about which A/B test performs higher, they visualize it for you.
Microsoft Clarity Heatmaps provide invaluable visual representations of user interactions, shedding light on where users click, move their cursors, and scroll. Clarity’s heatmaps are generated on the fly, with no creation delay, and return within seconds. They aggregate data to quantify behaviors and trends, helping you identify what content works best for your website or app. Plus, Clarity is free forever, making it an accessible tool for understanding user behavior.
Add Clarity to your site today!
Use our insights and analytics to wow your website visitors!