One of the benefits of Clarity is being able to dial in the interface to fit your needs when it comes to analytics, reporting and visualizations. We are excited to announce a new update to Clarity that will add further functionality for custom IDs.
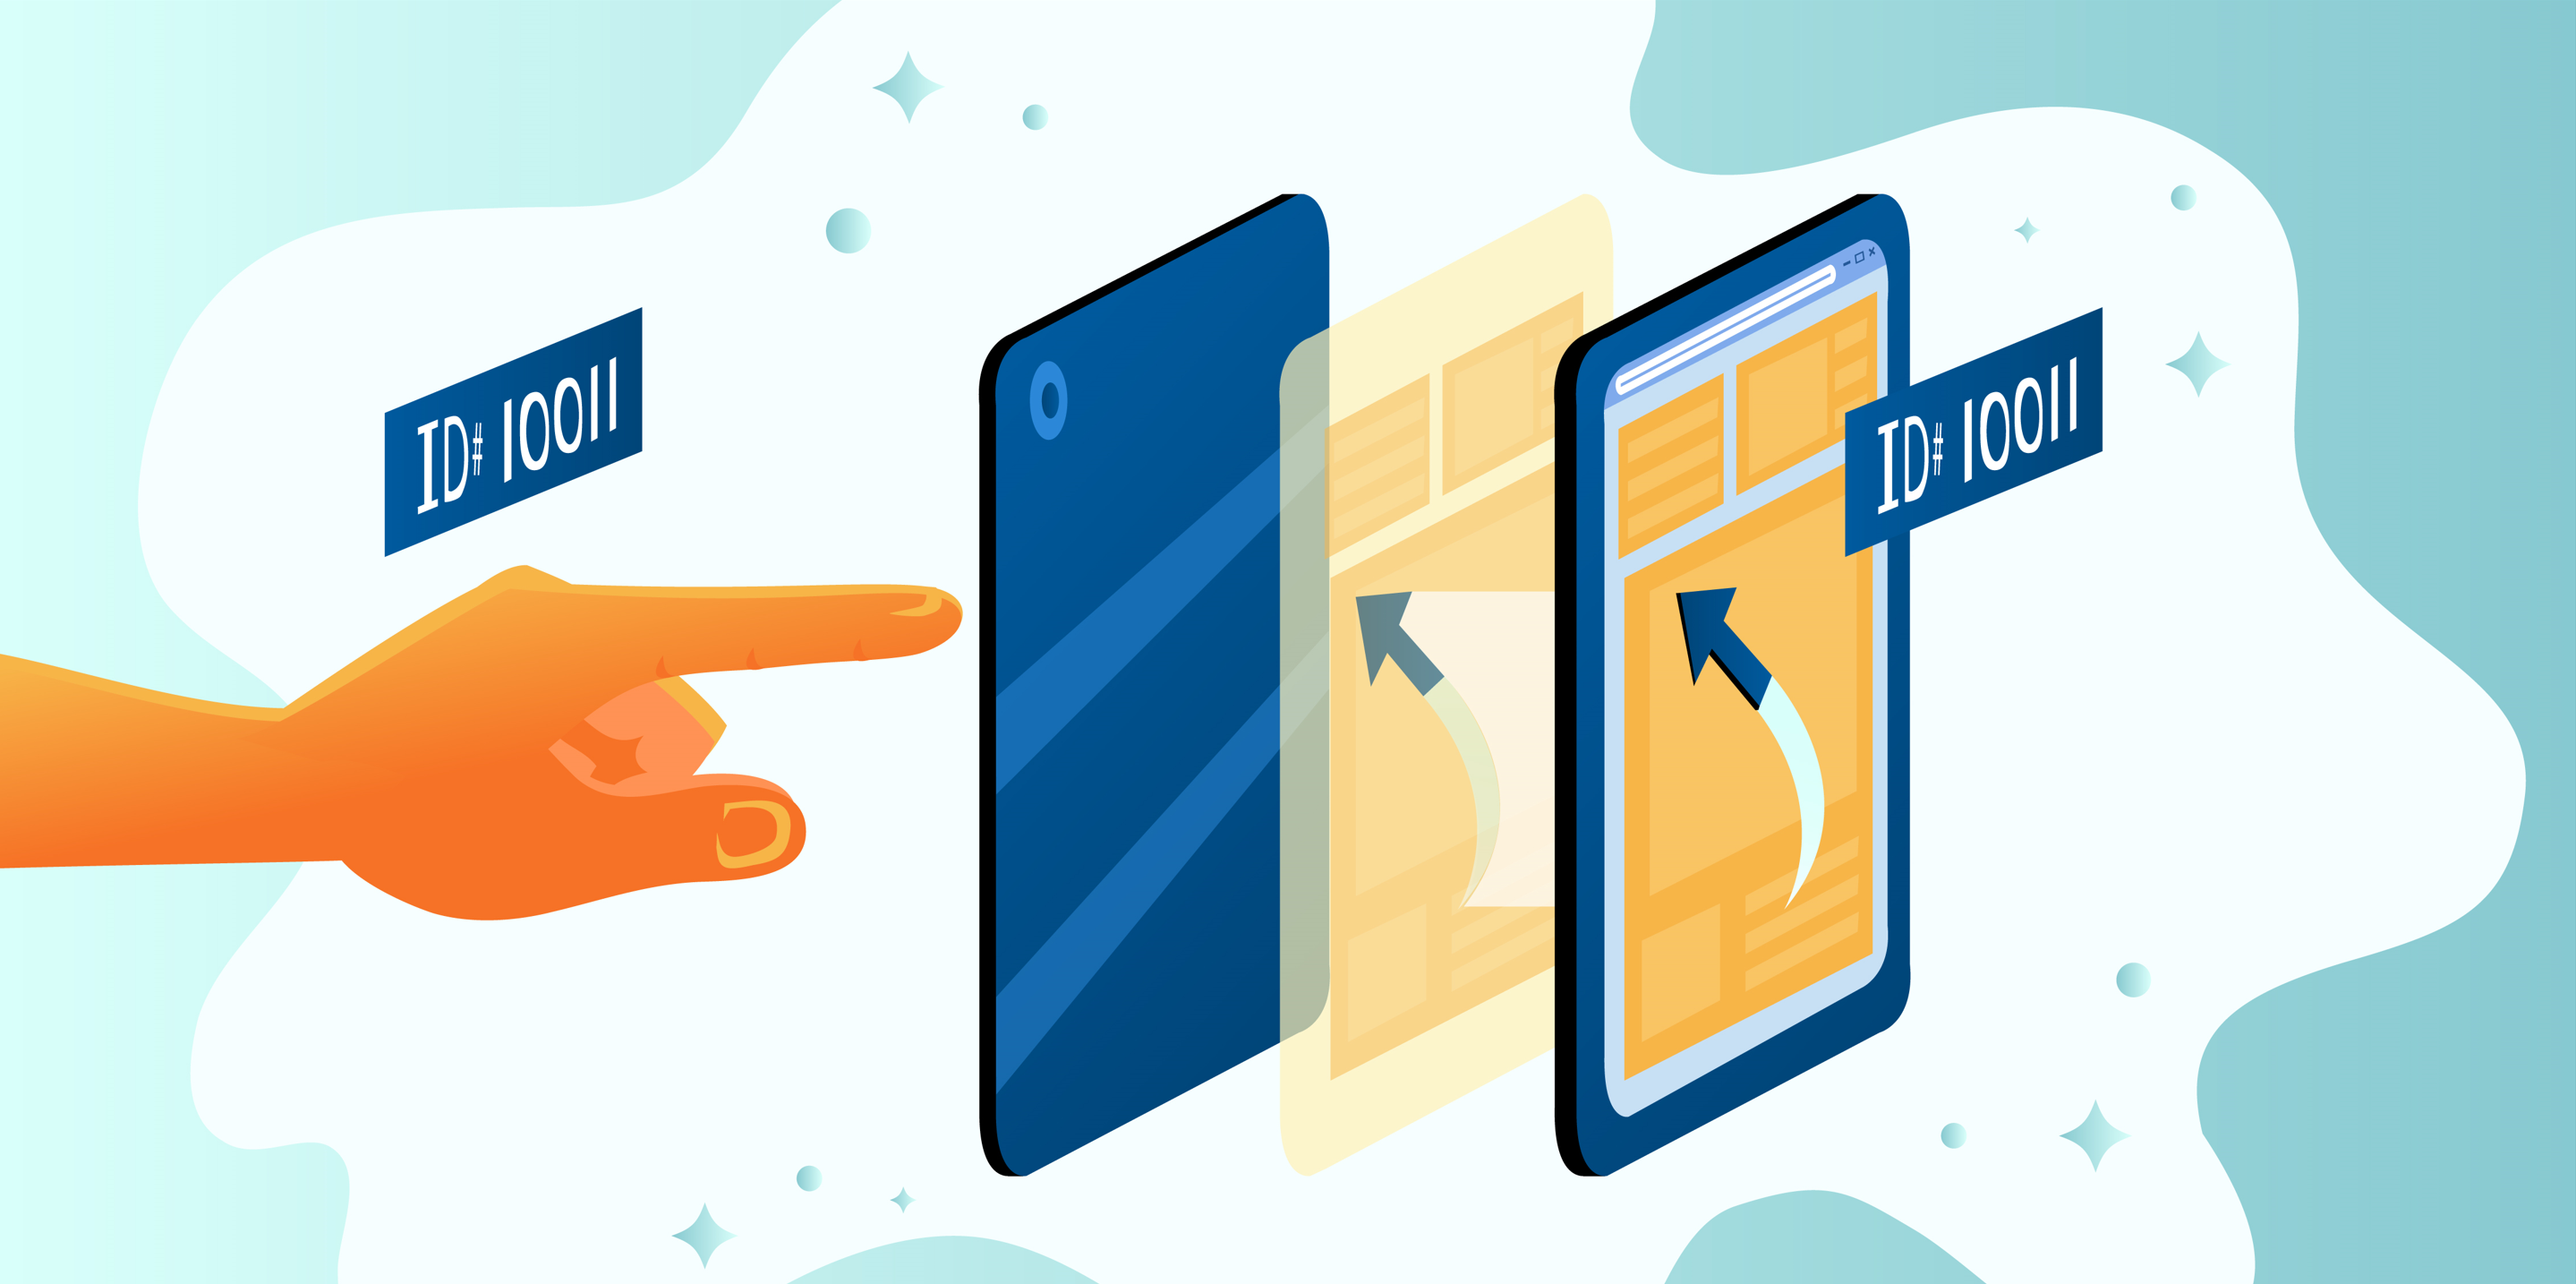
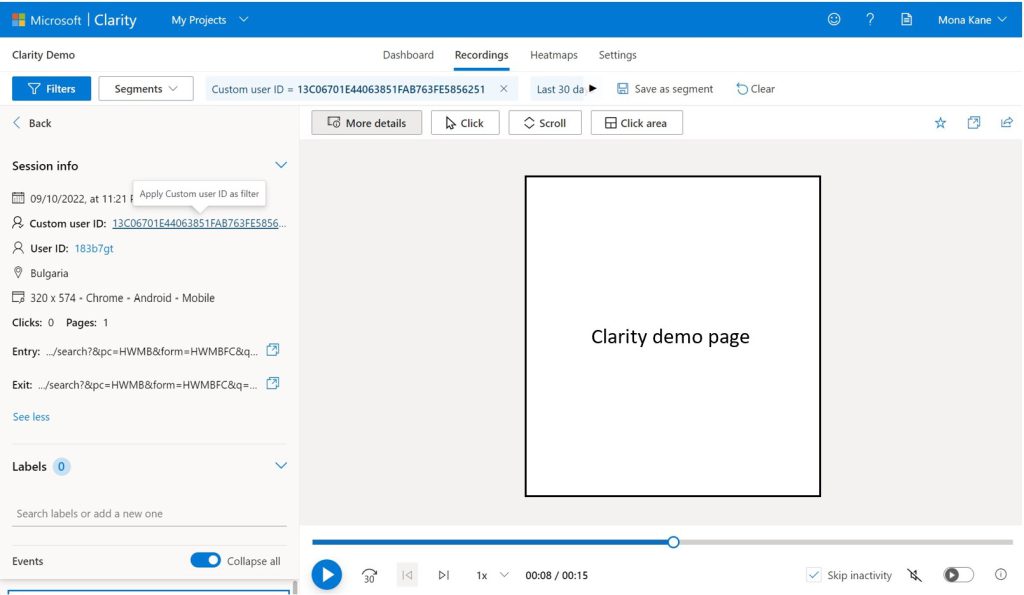
If you aren’t familiar with the user ID feature here’s how it works. A generic user ID is assigned to each visitor when they come to your site, the ID will be assigned to features like Screen Recordings. At the same time, you can also assign other custom identifiers for users, sessions, and pages if you want to track custom features on your site. As seen below, it was previously possible only to filter by the randomly assigned Clarity user ID.
After receiving your valuable feedback on expanding the custom ID feature, we categorized them into these top requests:
Making user ID clickable
A customized way to identify site attributes
Ability to filter by custom IDs
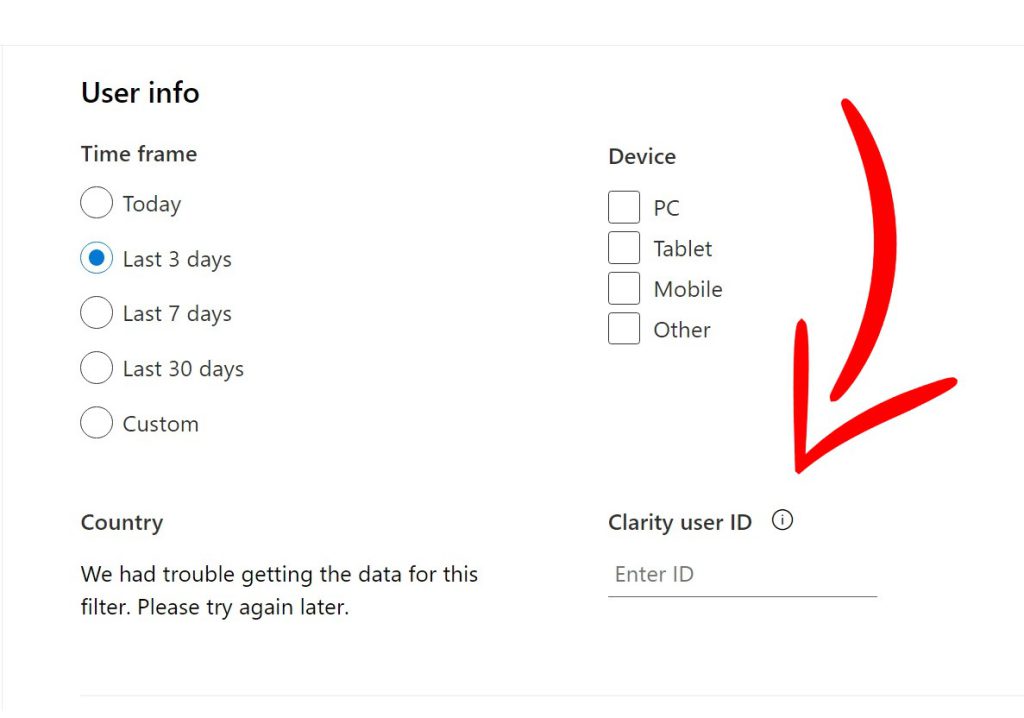
We took your feedback to heart and added new functionality for custom IDs. Take a look below to see how some of these new features will look. Both the details of custom IDs in session info and the ability to filter by custom IDs were added with this new release.
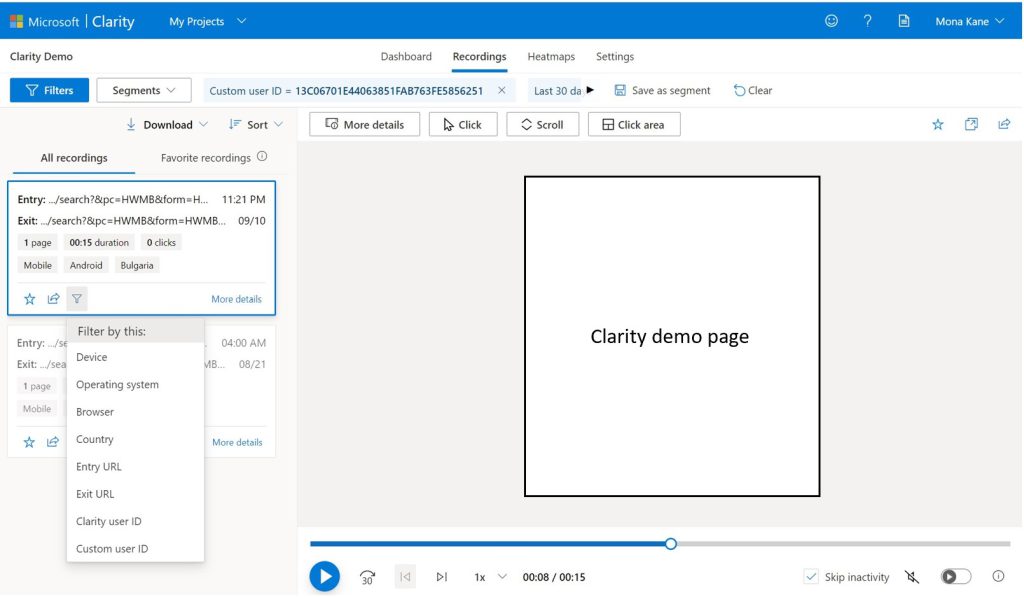
Above you can see the newly added filter fields which will allow you to filter by custom IDs.
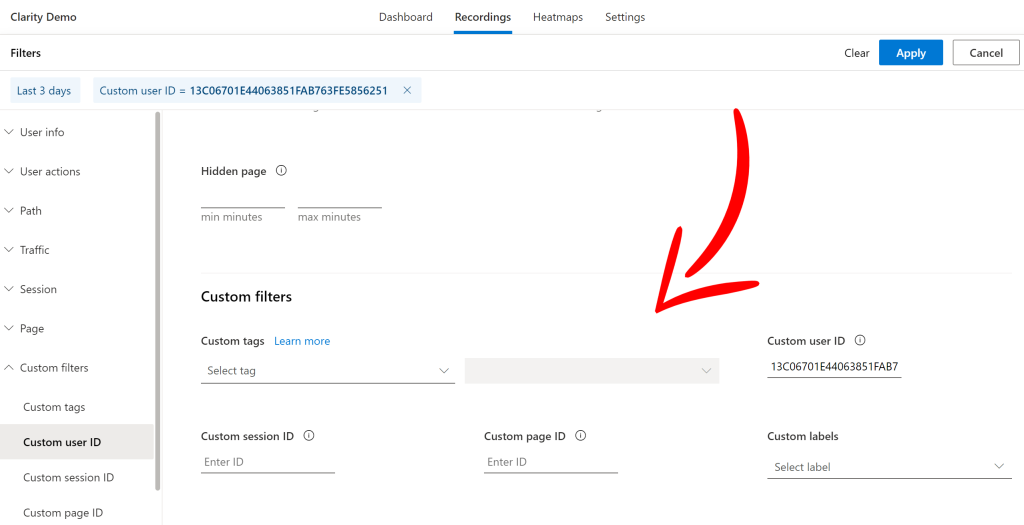
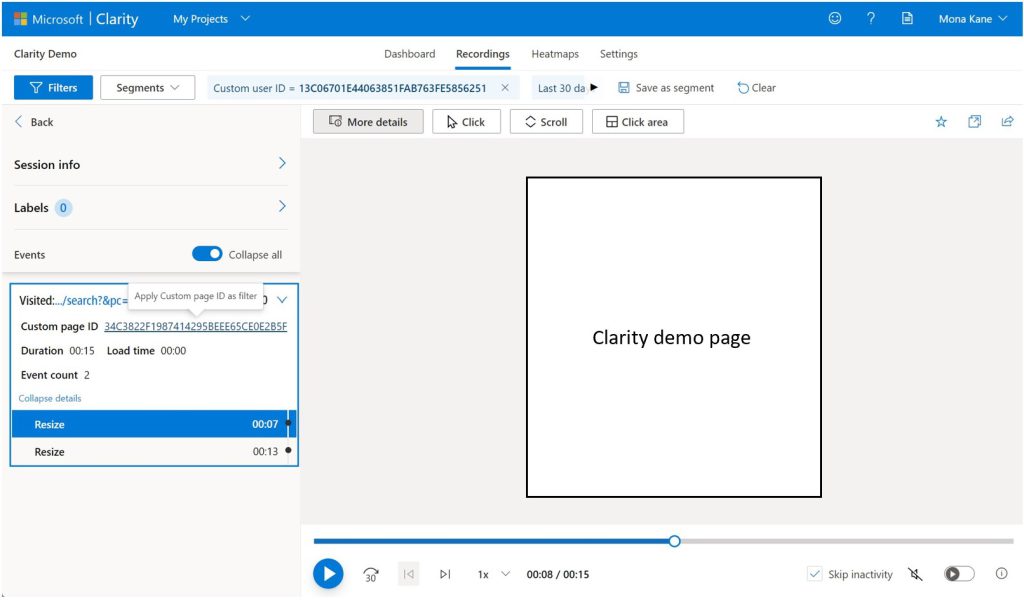
Above are how the recordings session info will look when utilizing the custom ID filters:
Custom user ID, session ID and page ID are included as part of the session info.
You can directly click on Clarity user ID or any of the custom IDs to quickly apply them as a filter and watch additional recordings for that user, session or page.
Custom ID is also added to the Filter by this list in each recording card.
We hope that these newly added features will allow you to better track and interpret customer data. As always if you have any feedback for us please reach out. You can also learn more about filters here, and to learn more about custom identifies and our API visit here.
Our team is super excited to announce the native integration of Microsoft Clarity in Softr.io!
Softr.io is a powerful software that can create apps, websites, client portals, and much more with just a few clicks.
It is the world’s largest ecosystem for building no-code apps. At Softr, they believe that everyone should have the ability to create the tools they need, without engineers or designers.
Through Softr.io you can now link data directly to Clarity! With heatmaps and session recordings, you’ll be able to visualize vital data feedback on the projects you created with Softr. Learn how to link your Soft.io data to Clarity here.
Mario Araujo, Growth Lead at Softr.io said:
“Softr.io makes app building as easy as Lego. With Microsoft Clarity integrated, they are now able to understand how their users interact with their web and mobile applications. It’s like having users sitting right next to you.”
Just another reason to join Clarity! A free-forever feature-rich user behavior tool! Get started today!
Google Analytics Integration: Find Out How Connecting GA & Clarity Benefits You!
You utilize Google Analytics for many reasons: to see how people (and who) find your website, track what they do once they arrive there, and to learn more about conversions to define strategy. However, did you know that by pairing it with Microsoft Clarity you can maximize your insights?
Google Analytics collects and displays to you raw data about your website such as sessions, users, page views, goal completions and more. This data comes as preliminary information to help you understand how people interact with your website. However, what’s missing is the ability to represent that raw data visually in recordings that come alive, showing the insights behind the data. Clarity makes it easier to interpret that data!
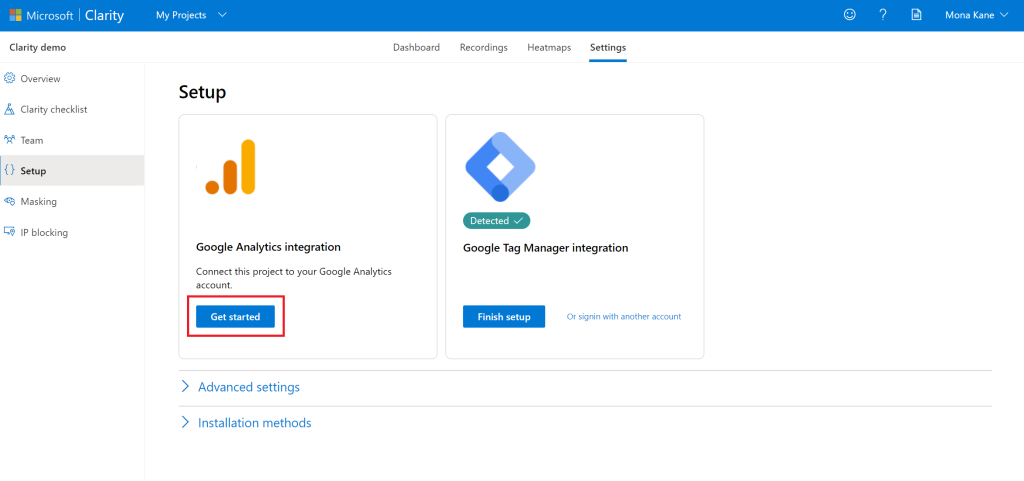
a. Go to Setup and select Get Started under Google Analytics integration.
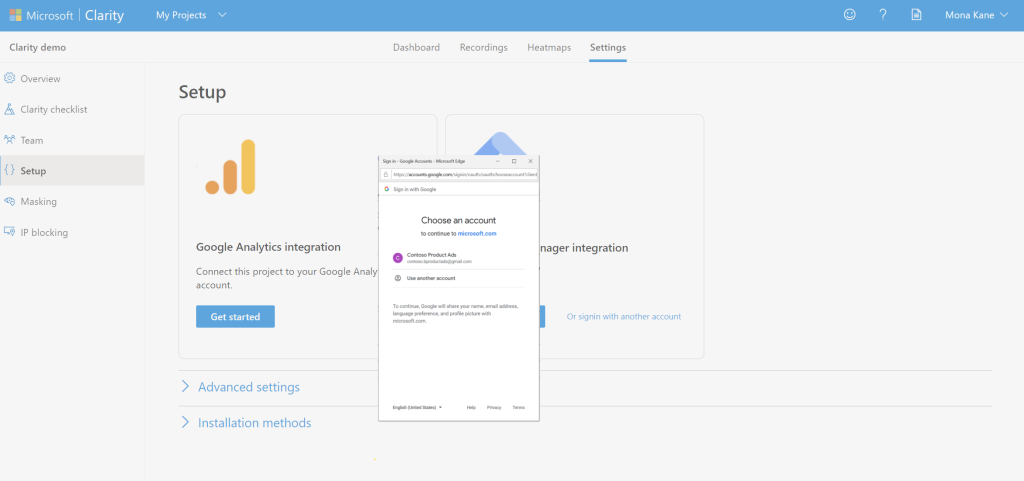
b. You’ll be redirected to Google to sign in. Choose an account or enter an email by selecting ‘Use another account’ and follow the steps.
c. On the dialog box, select the web property you would like Clarity to send data.
If you see the site in the ‘Site to connect’ menu
Select the site from the menu and select Save. You’ll be redirected to the Clarity Setup page.
If you don’t see the site in the ‘Site to connect’ menu
Select the option to enter your site manually (see steps in link).
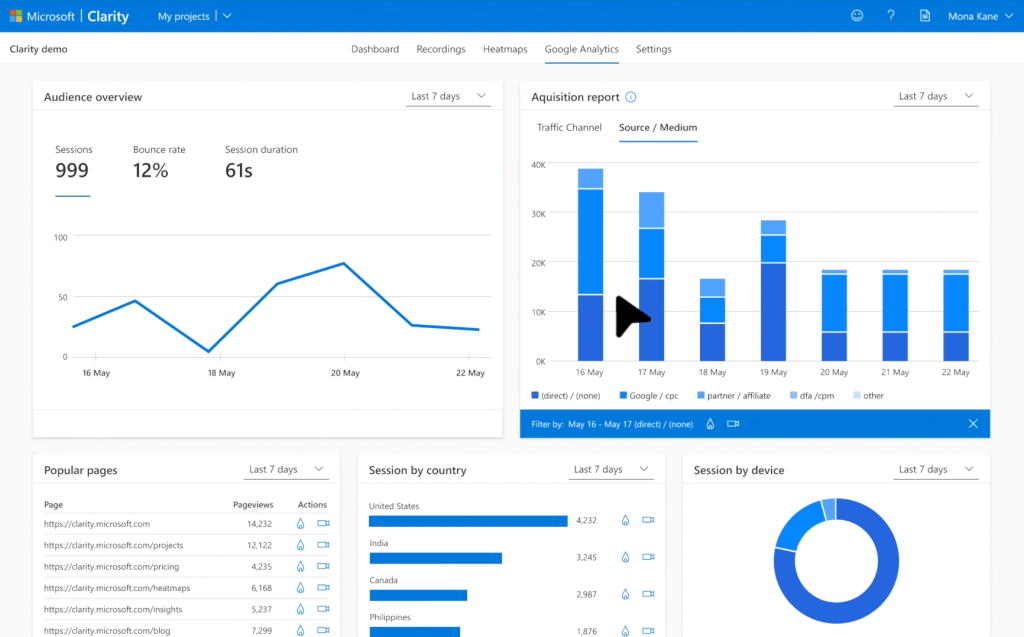
2. After you’re done with setup, you’ll now see a Google Analytics tab appear under your projects. You’ll also be able to explore a Clarity dimension within Google Analytics, which will add a URL to each page session that allows you to directly view Session Recordings and Heatmaps.
Benefits of adding Clarity
You can combine the visual learning behavior data of Clarity with the metric behavior data of Google Analytics to produce a very strong data set for your website or business.
1. Visualize Data:
Have you ever sifted through your websites Google Analytics data wishing there was an easier way to visualize, filter, and understand the data in a meaningful way? Clarity does just that, allowing you to watch session recordings for Google Analytics segments to better understand the data, so you to make more educated decisions for your business.
Integrating your Clarity project with Google Analytics is easy, and allows Clarity to link session playbacks with your Google Analytics dashboard (see above). Once you identify the sessions you need more information on, just jump to the GA Dashboard to debug and understand user pain points.
2. Understand Customer Behavior:
The whole reason we use software like Google Analytics is to understand what our customers want, and how we can improve their experience with us. Raw data is great, but with Clarity your understanding is taken a step further with Session Recordings (a feature that allows you to see how people are actually using your site through recorded sessions), Heatmaps (which allows you to determine the ideal page length for maximum conversions and show how far your users scroll on pages), and report visualizations. These features allow you to not only see the numbers but put yourself directly in the shoes of the customers.
3. Improve GA Goals:
Being able to measure the success of your businesses efforts is key to understanding what’s working and what’s not. Goals in Google Analytics are trackable user interactions within your website that you deem to be the most valuable to your business. Without Goals, you might still get some valuable insights from Google Analytics about the use of your website. However, those insights will probably just lead to questions about if and how those results positively or negatively impact your business’s success. The use of Google Analytics goals is improved greatly with Clarity. Clarity allows you to explore sessions where users complete a goal and get insights into why some users drop off. You can also view related recordings and heatmaps for every step in the funnel. Goals are automatically imported into Clarity, so there is no need to re-create them.
To learn more about integrating Clarity with Google Analytics visit here.
Looking for the latest and greatest behavioral analytics tool but trying to stay within a budget?
How does FREE sound?
Just make sure you get everything you need from a tool to conduct that behavioral analysis. Don’t worry we went ahead and broke down exactly what you’re getting from these free plans.
First, you need to ask yourself a few questions:
Do you foresee your business growing?
Do you require advanced filtering for segmentation?
Are you looking for a Dashboard packed with data?
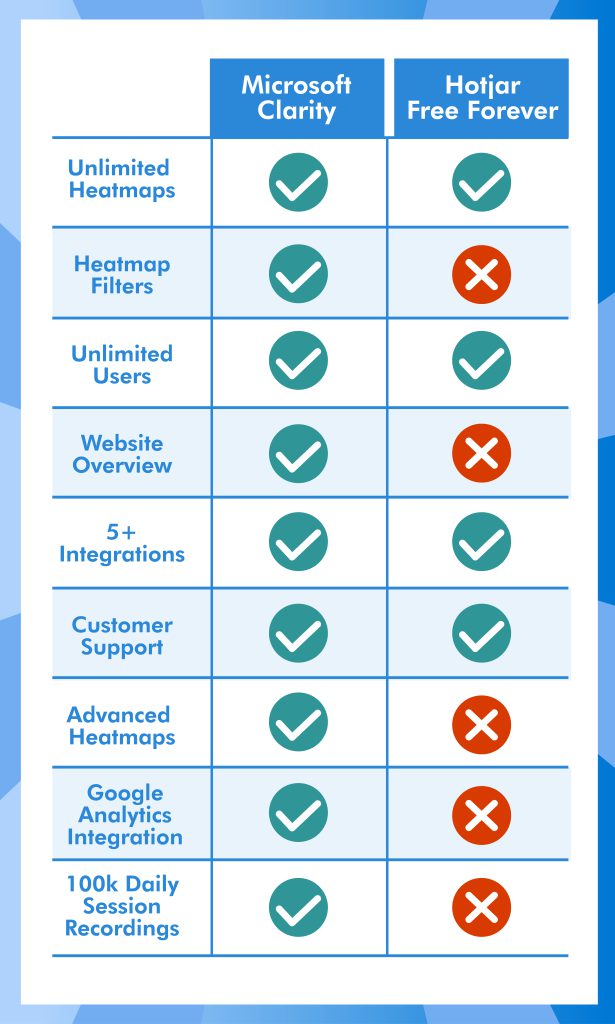
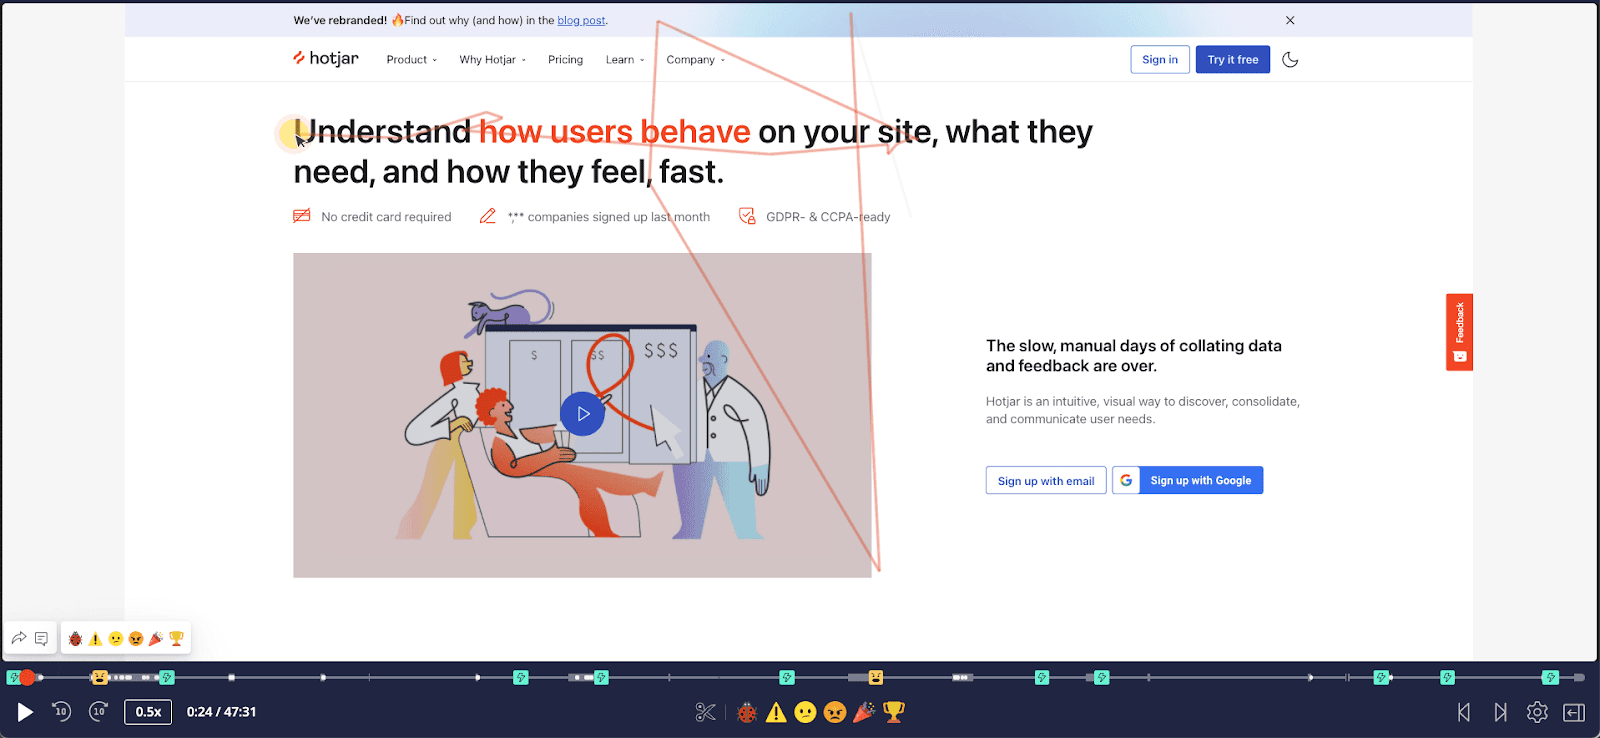
Now let’s look at Clarity, and Hotjar’s Free Forever plans have to offer!
Improve the buying experience with Clarity!
Use our insights to wow your visitors and turn them into customers! Free forever!
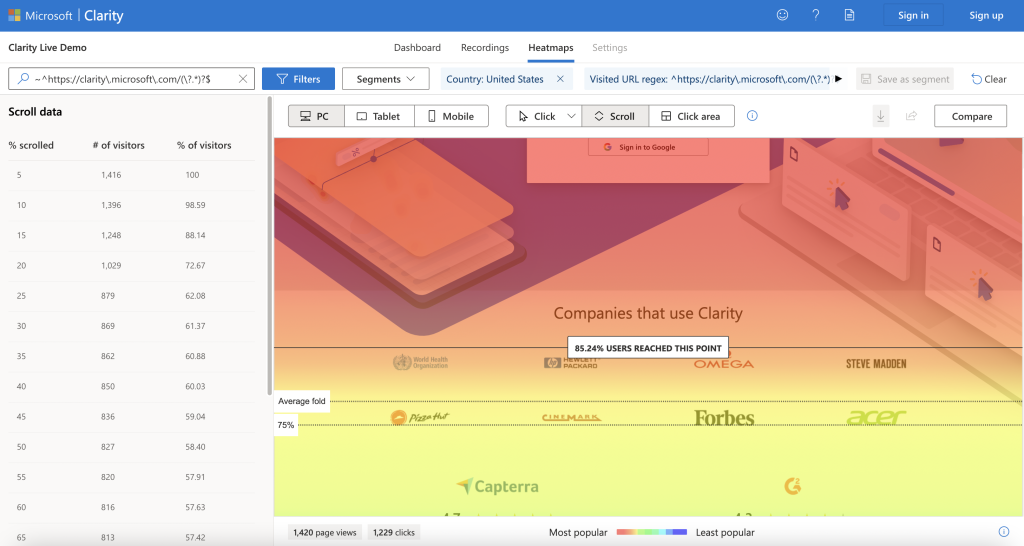
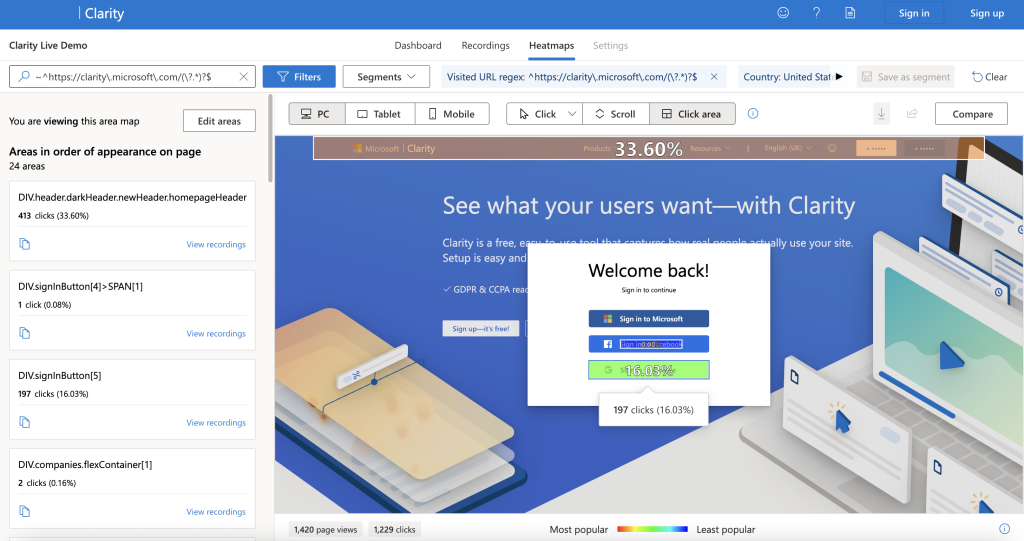
Clarity comes packed with a ton of heatmap features. You have a choice to look at your website through a click, scroll, and area heatmaps. Clarity also offers an extension for your browser to see the heatmaps on your website directly.
Click Heatmaps – A visual thermodynamic map that illustrates where the users are clicking on your website.
Scroll Heatmaps – shows the percentage of users that scrolled to a certain distance on your website. This is often used to prioritize where the call-to-action buttons or other important elements should be placed.
Area Heatmaps – Show the total number of clicks within your chosen area. This provides a clear aggregated look into the engagement with given website elements.
Advanced Filtering – Need to nail down a specific group of users? Microsoft Clarity offers many filtering options to get exactly what you need from your data.
Session Recordings
Sometimes we need to go further than the numbers when it comes to solving a problem or coming up with an idea. With session recordings, you can see exactly what your users are doing on your website. Watch them as they navigate through your website, and easily share the high-def recording with your team or outside investors.
Insights
With Clarity, you’ll be able to get insights into some stuff you probably wouldn’t even think of, but don’t worry we’ve got your back and have the solution for you!
You’ll be able to see when users run into issues such as rage clicks, dead clicks, quick backs, and more. All which can be filtered in session recording to see exactly what problem your user encountered. Say hello to website optimization!
Unlimited Users
We are all about collaborative work at Microsoft, so invite as many people as you want onto any Clarity project you own.
Google Analytics Integration
The dream team is here! That’s right, Microsoft Clarity working side-by-side with Google Analytics to bring you the best of both worlds! Explore your segmented audiences, view Google Analytics data in Clarity and visa-a-versa, and improve your conversion goals and marketing funnel.
Segmented Audiences – the key to unlocking the full potential of any digital strategy is being able to segment your user base into audiences. Clarity and Google Analytics together make this a much easier process.
Google Analytics in Clarity – Enjoy your Google Analytics right inside your Clarity platform. No more switching back and forth between platforms.
Clarity in Google Analytics – Need to get some work done inside of Google Analytics? No worries, we thought of that too! Enjoy Microsoft Clarity right inside your GA dashboard.
Improve Conversion Goals – with the Google Analytics integration; you can improve your conversion goals by seeing video recordings of each step of the funnel, which allows seeing where any friction points may appear.
Customer Support
There are 2 types of customer support that Clarity offers. One is the feedback tool on the projects page, and another is our support alias (msclarity@microsoft.com), where customers can directly reach out to our support team. It’s on our product roadmap to improve the customer support experience, stay tuned!
What Features Come with Hotjar’s Free Forever Plan
Heatmaps
Similar to Clarity, Hotjar has a robust inventory of heatmaps available to its users. You’ll even find an extra one called move maps that Microsoft Clarity no longer offers. Unlike Clarity, the heatmaps don’t allow for filtering on the free forever plan. This will make it difficult to find specific data points you’re looking for with ease.
Sessions Recording
Hotjar comes with high-def screen replays that offer custom highlights you can share with your colleagues. They also have an out-of-the-box integration with Slack to make sharing seamless.
Unfortunately, if you already have a decent amount of website traffic or plan to have more, you’ll hit a 35-a-day sessions recording limit needing to be upgraded to the paid plan.
Unlimited Users
Hotjar is big on collaboration, and they make sure this is possible with unlimited users. This is even true for their Free Forever Plan as well.
Customer Support
At Hotjar, they have a friendly bunch of customer support specialists, always available to offer you personalized support. They respond to every email ticket within 48 hours (sometimes less!), giving you peace of mind when using their tool.
At the start, we asked three questions about your needs. Now that we took a look into what both of these tools offer, let’s focus on you!
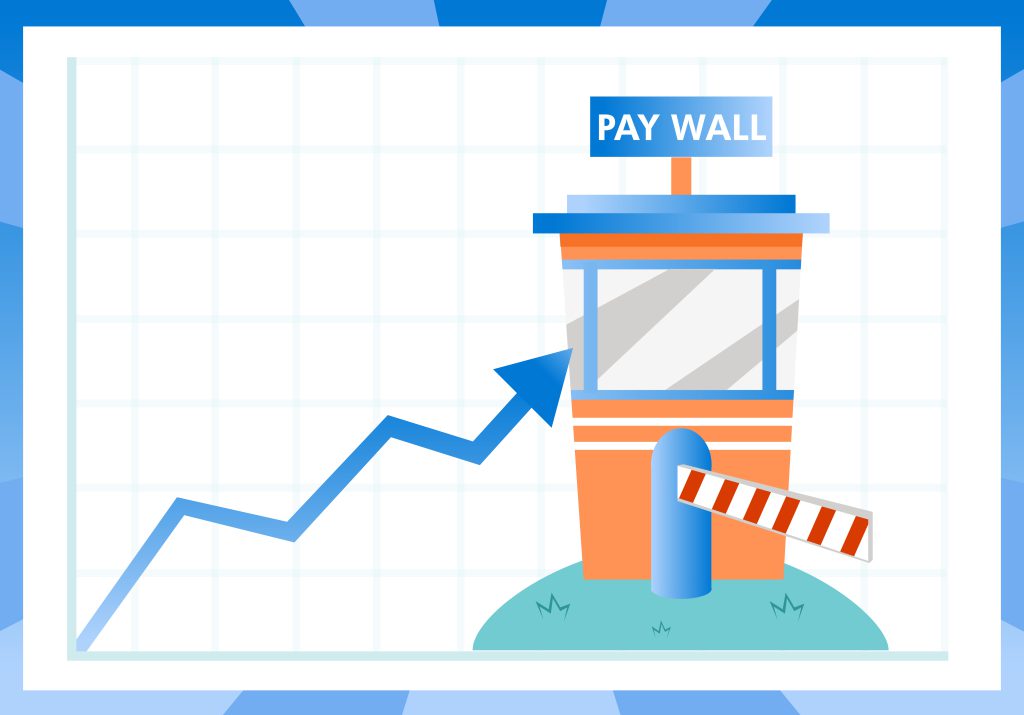
Do you foresee your business Growing?
How often have you run into monthly thresholds and mandatory upgrades as your business grows?
If you’re tired of dealing with this issue, then Clarity is just what you’re looking for. No limits. No fees. No restrictions. You get everything you need for your behavioral analytics completely free. At Clarity, we encourage you to grow and be successful. We would take it a step further and say we would be honored to do a case study on how Clarity helped your business grow.
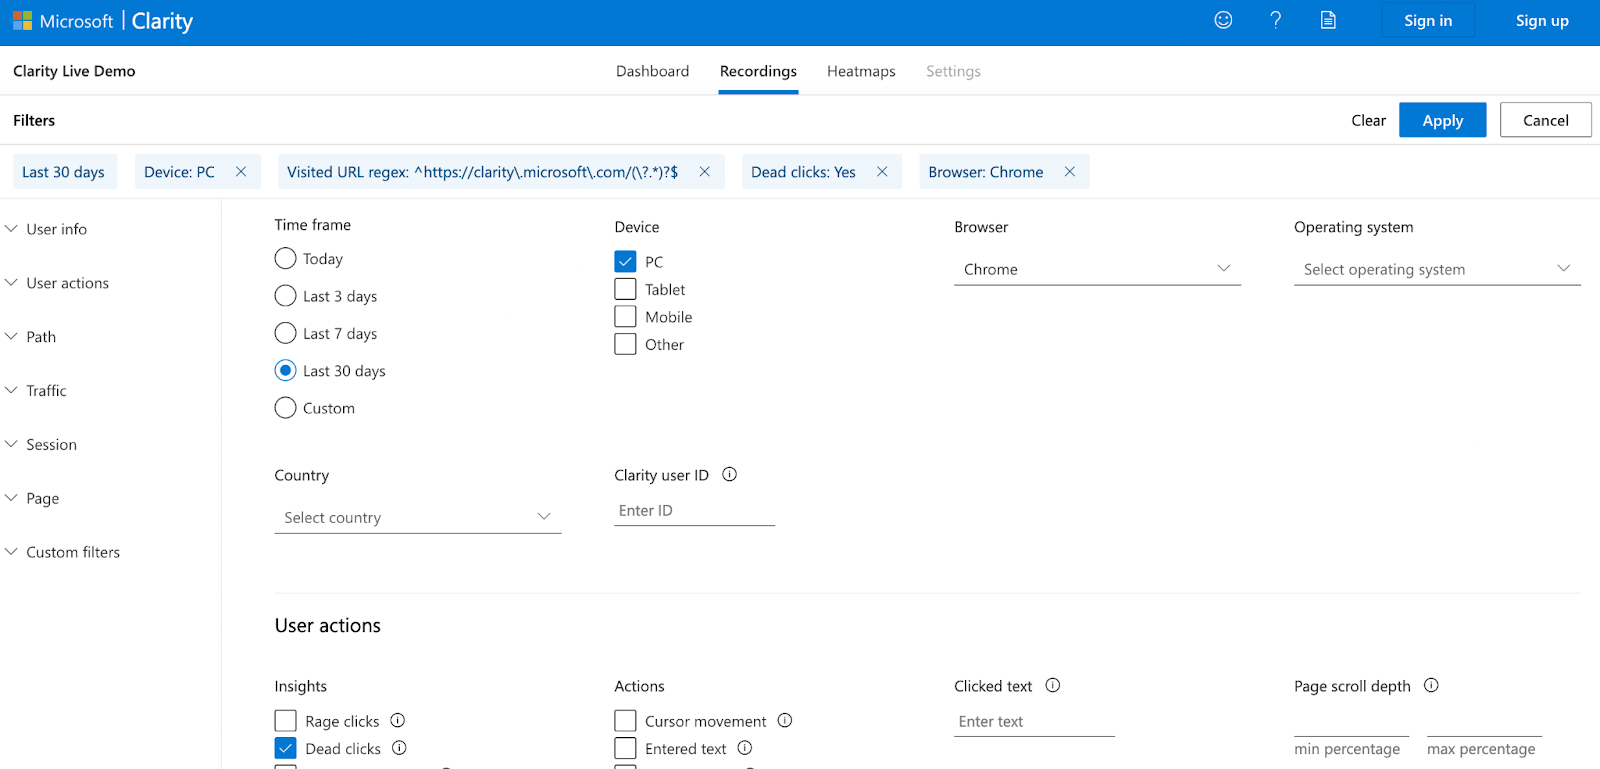
Do you require advanced filtering for segmentation?
Data has become an essential aspect of every business model. Advanced filtering allows you to create segments and explore them deeply and efficiently within Microsoft Clarity. For example, if you wanted to segment the past 30 days of PC users, using chrome, and that encountered a dead click you can. Save it and run that query whenever.
Are you looking for a Dashboard packed with data?
Everything is starting to come together on your website, and we know where to view it, the Clarity Dashboard. The team created a place where key events are neatly organized and easily downloadable to share with team members.
Is Hotjar’s Free Forever Plan Right for you?
If you like that slack integration to collaborate with your team, Hotjar might be the right pick for you (maybe we will be supporting this soon too…hint hint 🙂). The downside is the daily recording limits and the inability to filter your heatmaps.
Is Clarity right for you?
For free behavioral analytic tools, it doesn’t get better than Microsoft Clarity. Clarity offers everything that most top-tier paid plans that competitors offer, for absolutely no cost.
Ask yourself one last question, do you want to get approval to implement your fancy new behavioral analytics tool on your website, then come back a few weeks later asking your boss for money to upgrade your plan?
We don’t think so either!
Sleep with ease knowing you have everything you need from a behavioral analytics tool such as heatmaps, session recordings, advanced filtering, and much more at no cost. Get clarity—with Clarity.
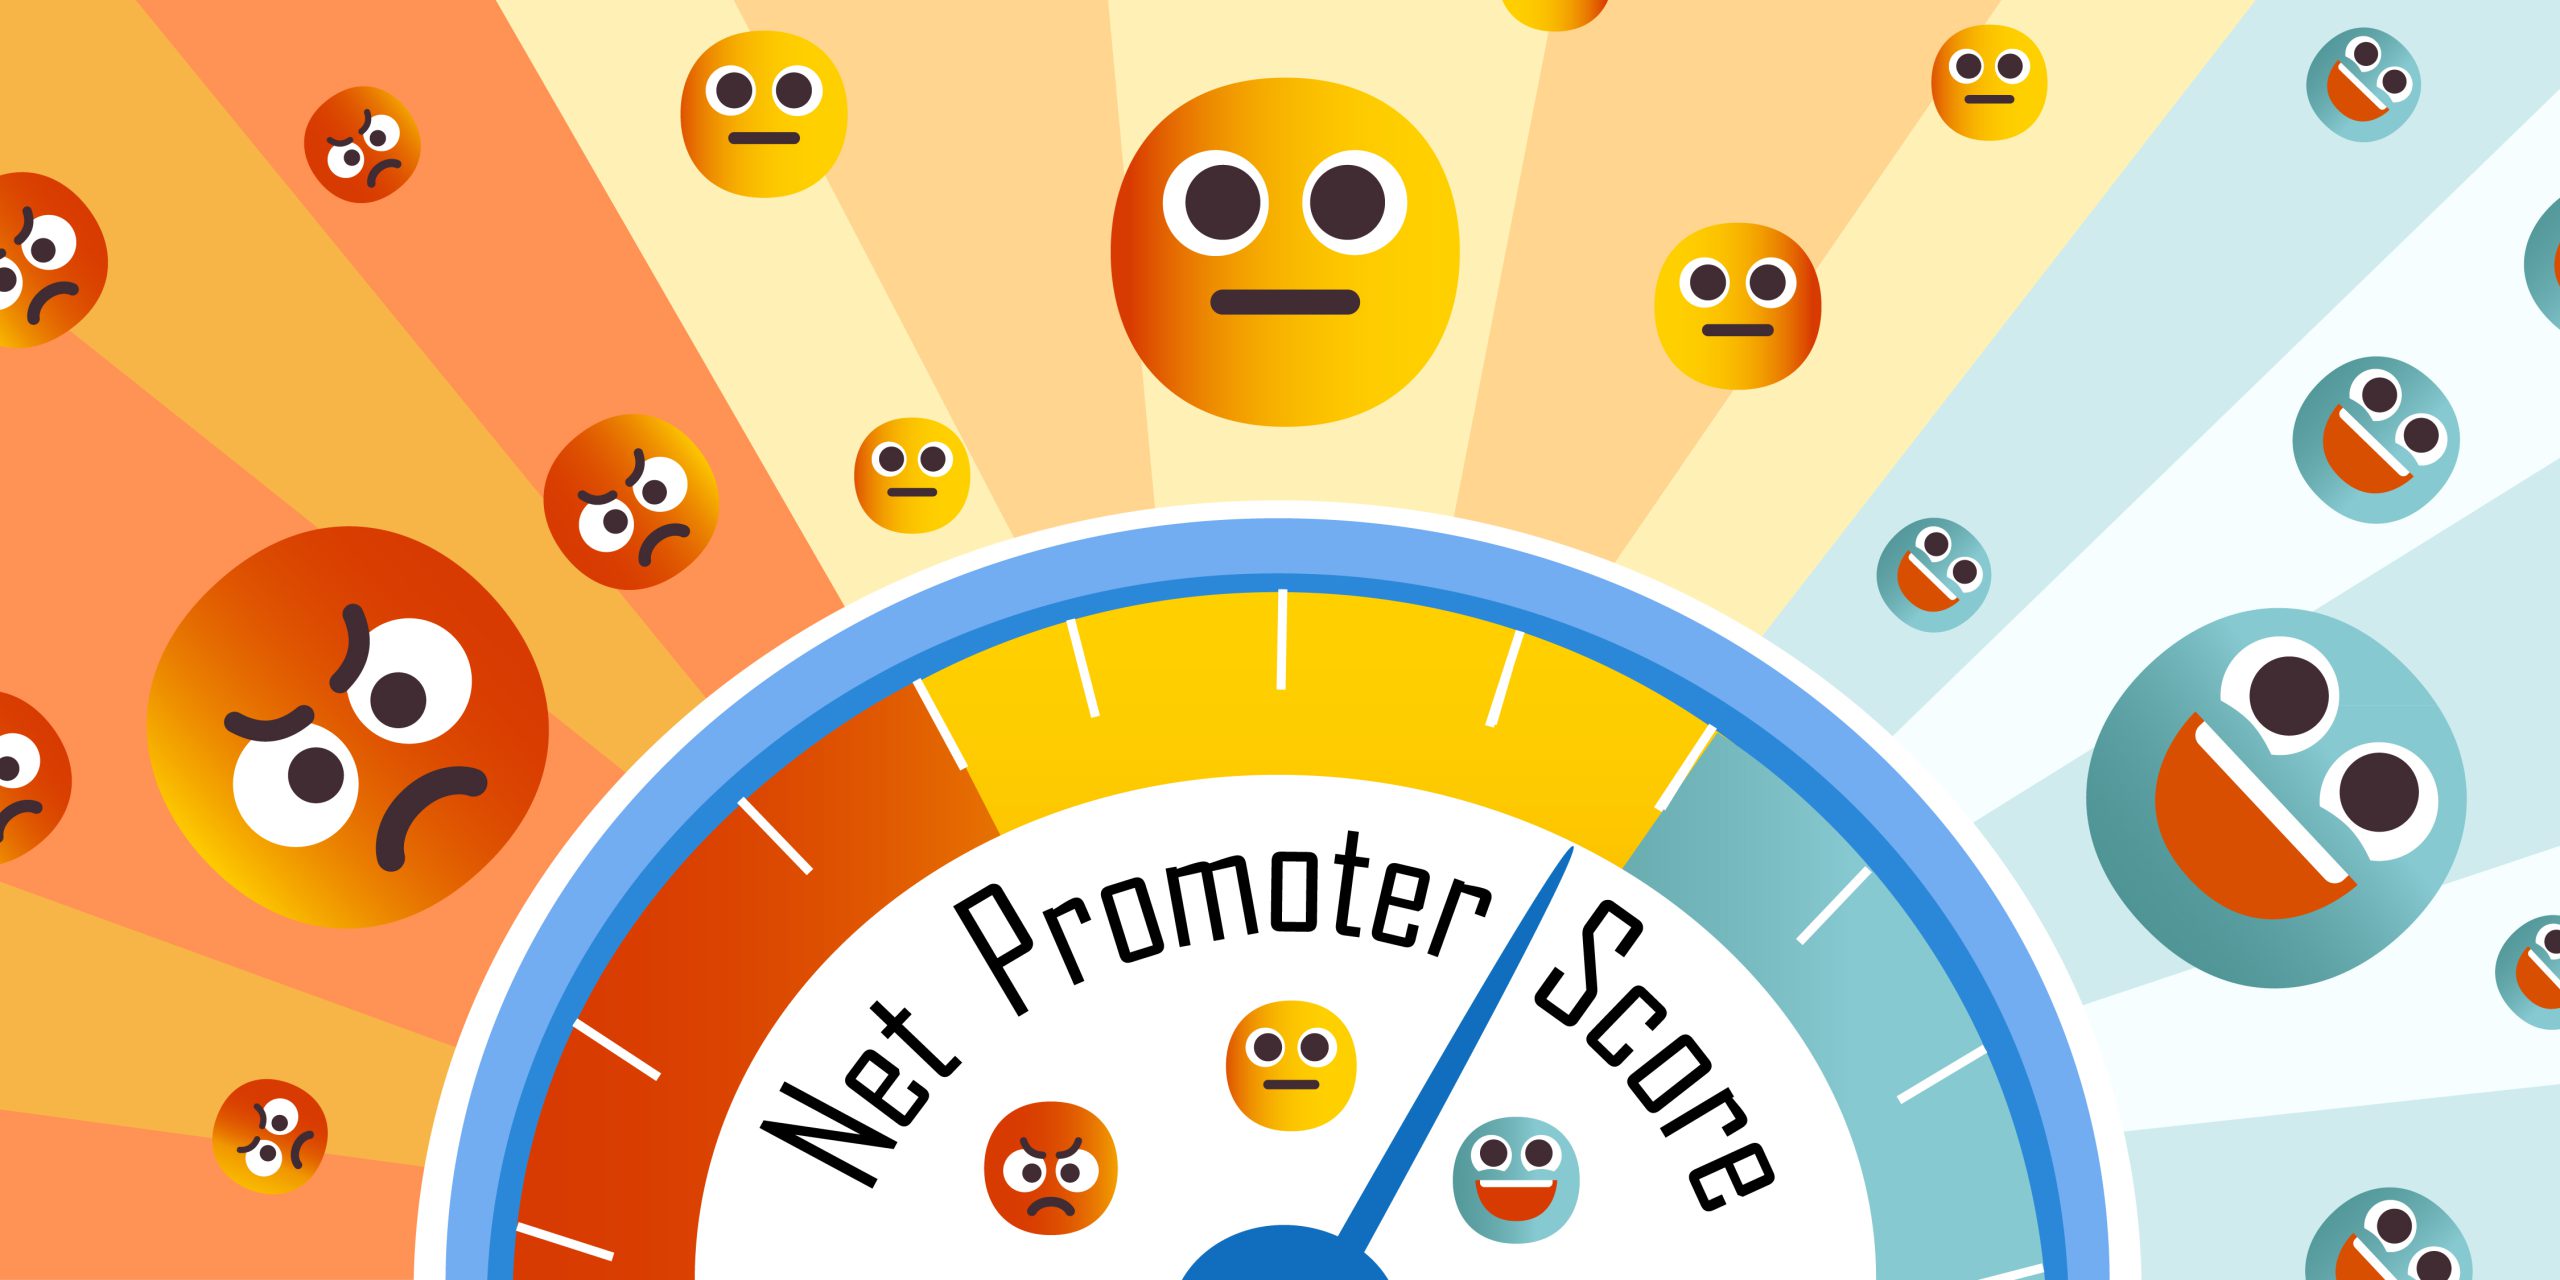
Curious about how your brand is perceived online? Trying to understand opportunities to improve? Let us share with you about NPS and how Clarity can help you optimize it.
Net Promoter Score (NPS) is a metric that tells how likely your customers are to recommend your product or service. It is based on their score and placed into three categories — promoters (9-10), passives (7-8), and detractors (6 or less). With NPS, you can see who is talking about your brand online and learn which areas need improvement. By using Clarity, you can identify high-priority on-page issues that can improve the NPS score for your company.
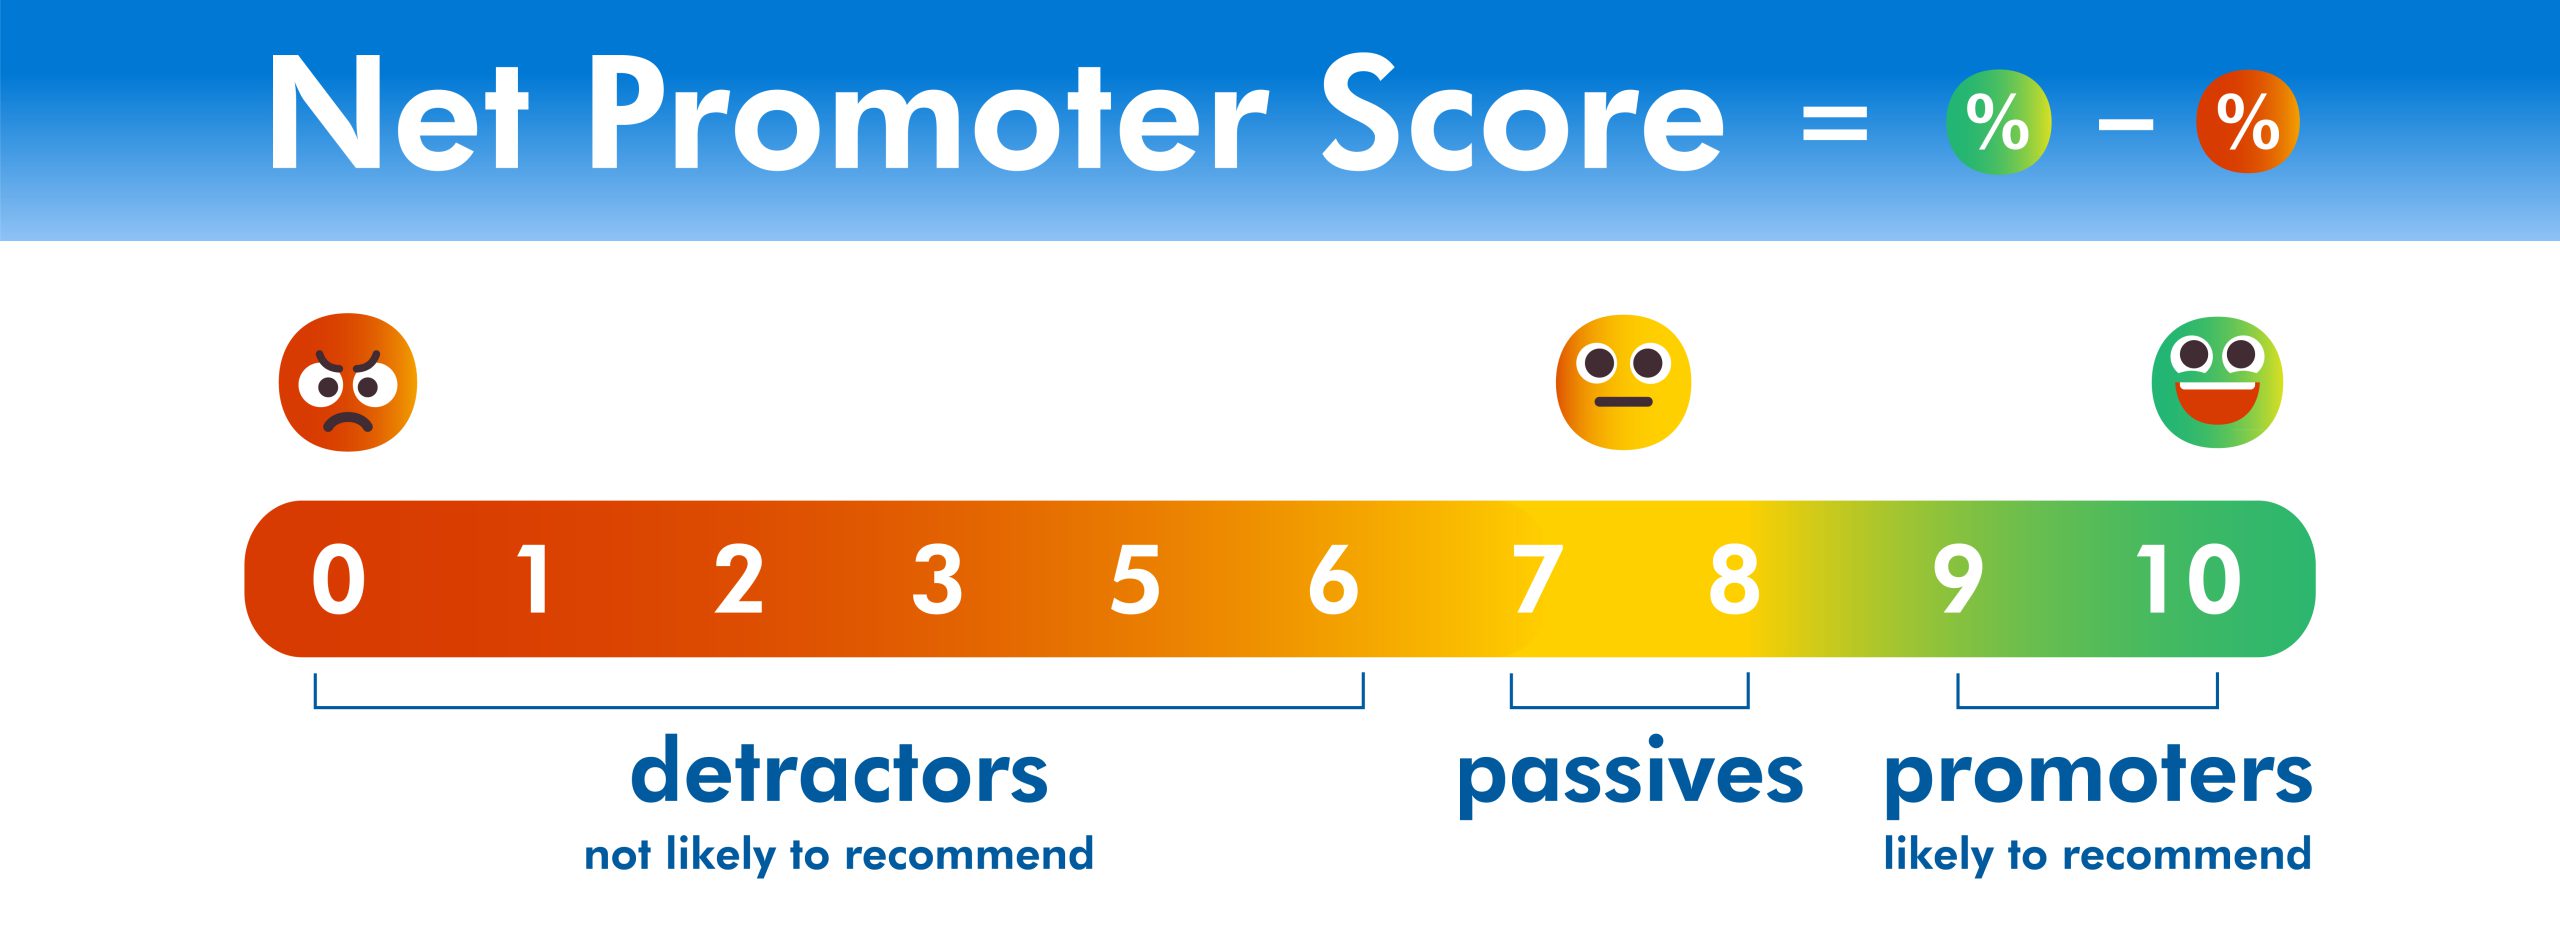
Net Promoter Score Scale
Before calculating your NPS score, you must collect customer feedback using a 0-10 scale. As shown above, anything below 6 is a detractor, 7-8 a passive, and a 9 or 10 is a promoter. These will be the three variables that you will use to measure customers when calculating the NPS score.
Promoters (9-10) are your cream of the crop users. They are most likely to leave positive reviews, refer to their friend or colleague, and be loyal customers that help you surpass competitors in your industry.
Passives (7-8) are not included in the NPS calculation but are still crucial to the company. These people can very easily be tilted in either direction and with a little nurturing, these customers can become promoters.
Detractors (0-6) will likely be the individuals leaving negative reviews after their unsatisfied one-time purchase. Detractors shouldn’t be dreaded but embraced because they offer valuable feedback on where you need to improve your company or product. Take their words seriously, and you’ll improve customer satisfaction.
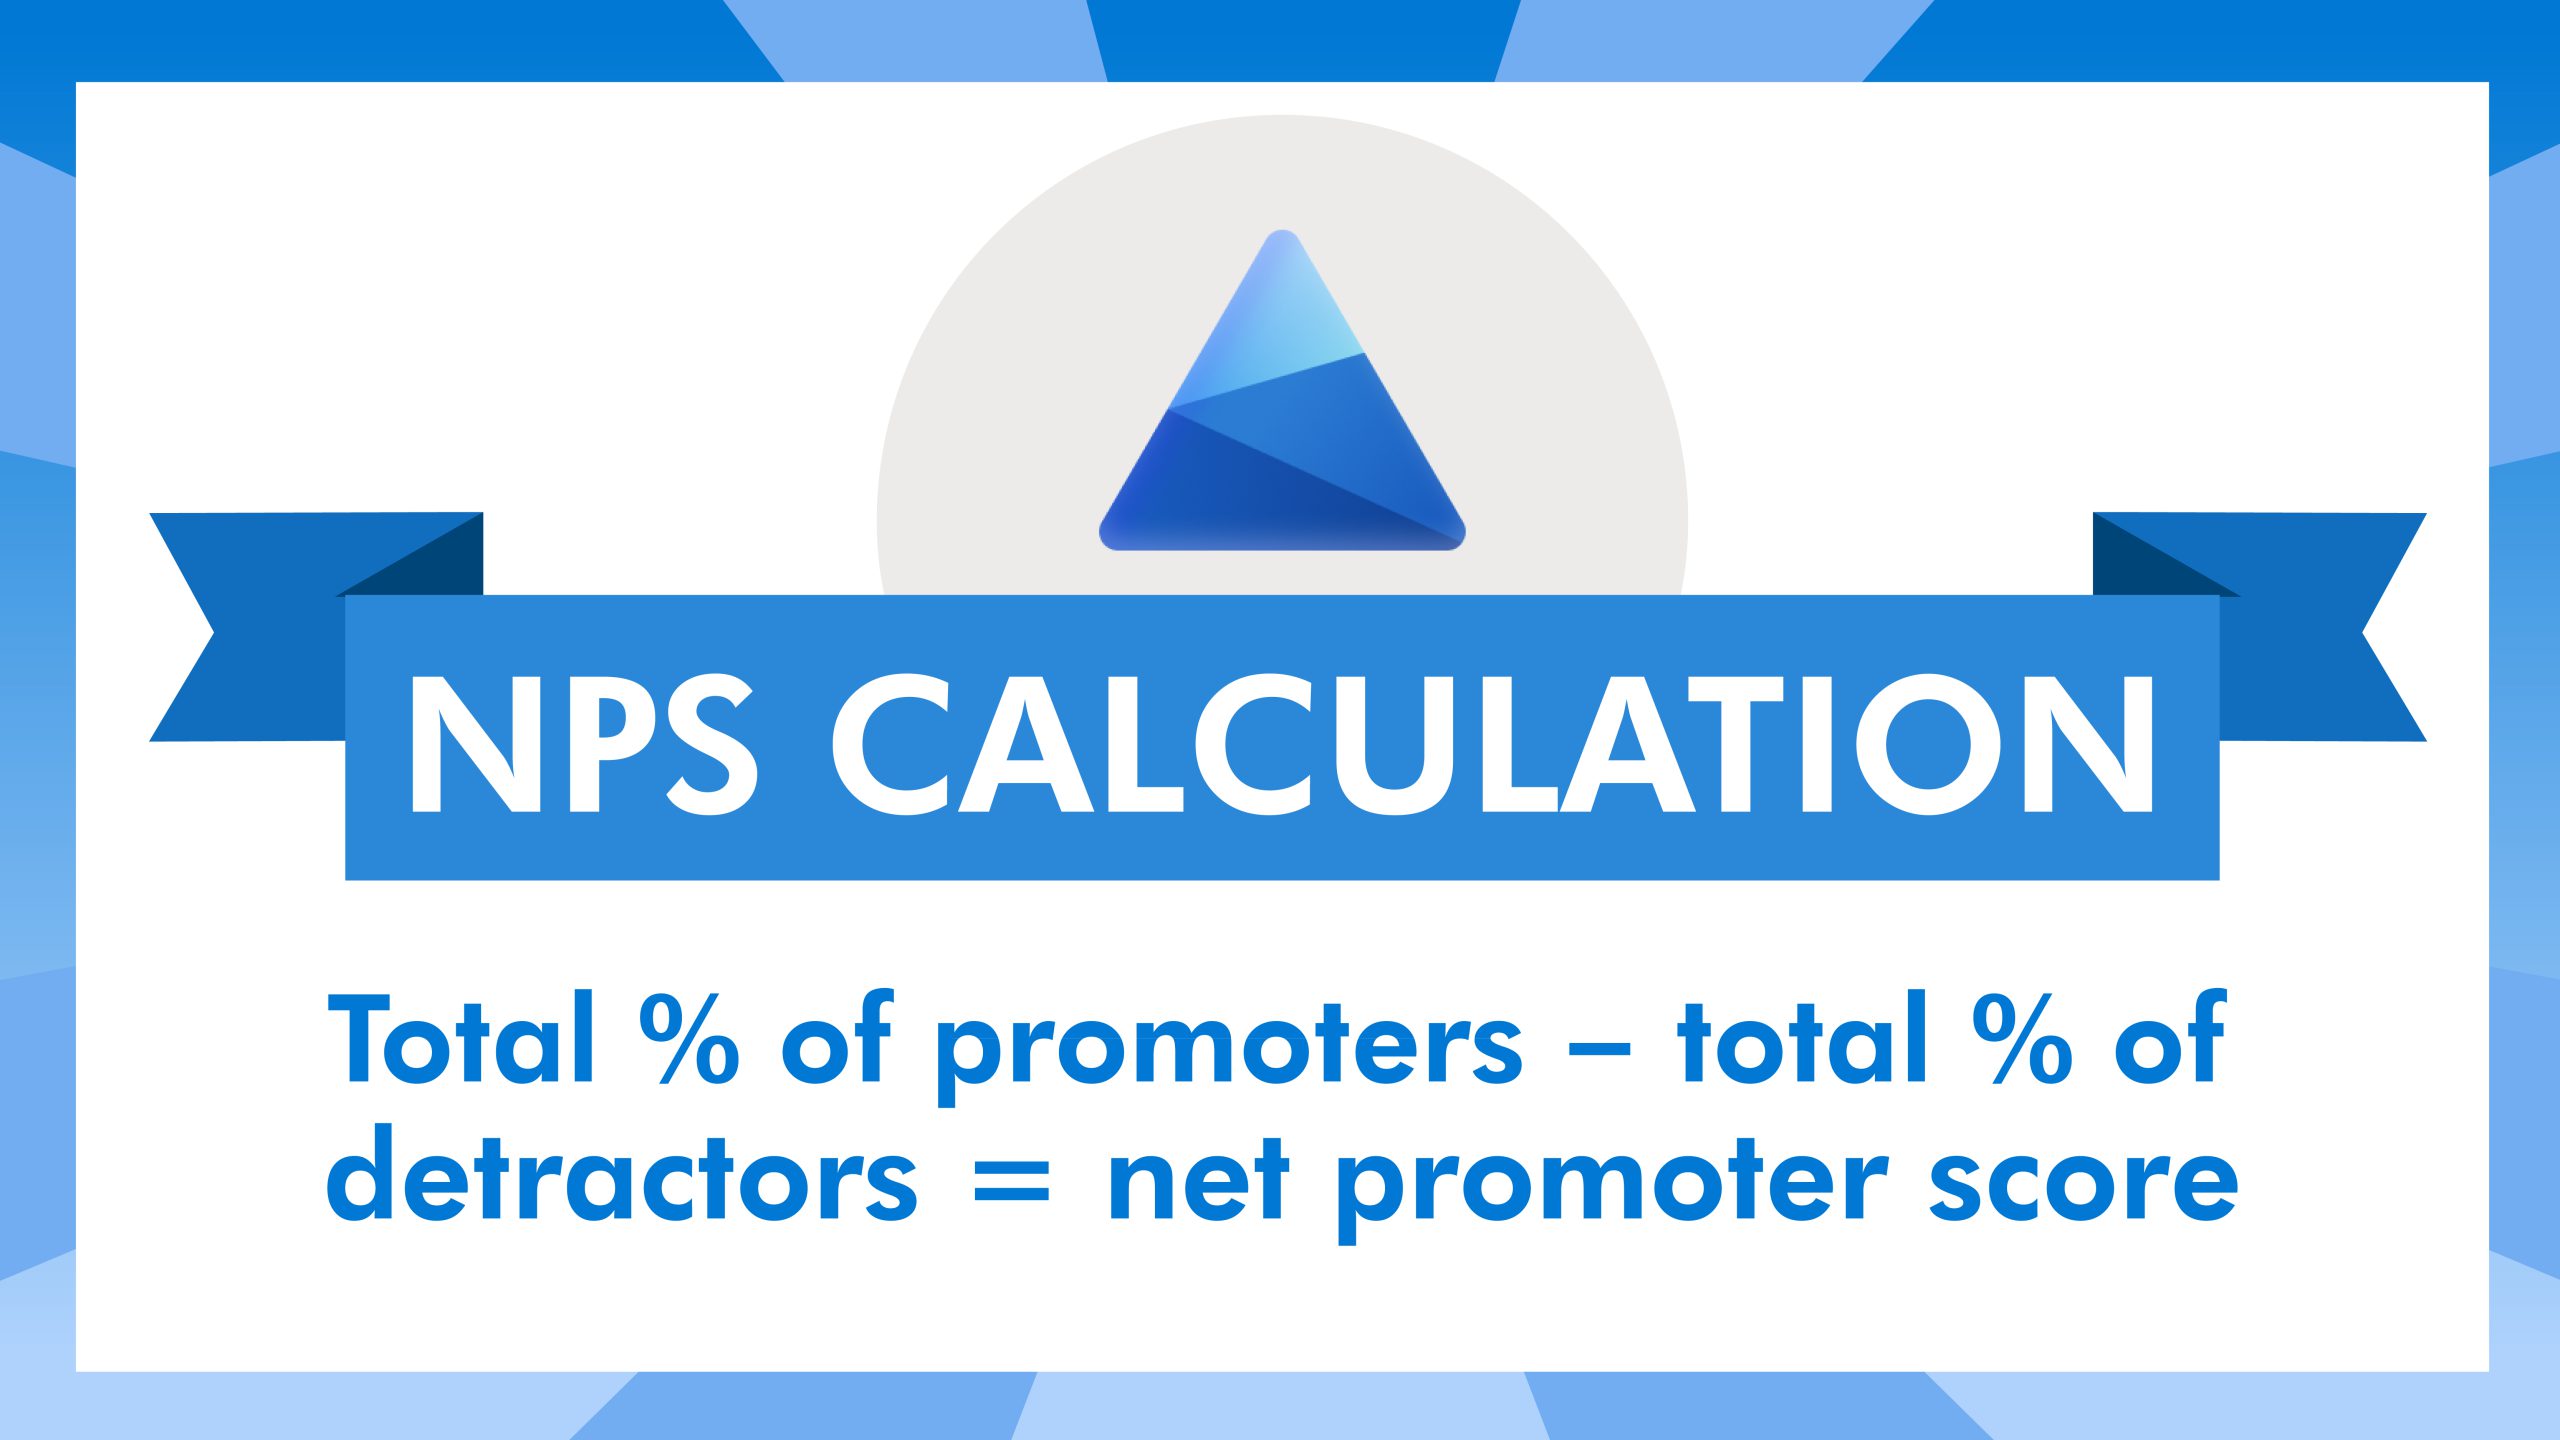
How to Calculate NPS
NPS is a simple formula calculated by subtracting the percentage of promoters by the percentage of detractors. You will ignore the passives (7-8) group since they will likely shift in either direction.
Net Promoter Score Calculation
What is a good or bad NPS score?
You’ve calculated your NPS score and now you want to know if your NPS score is good or bad.
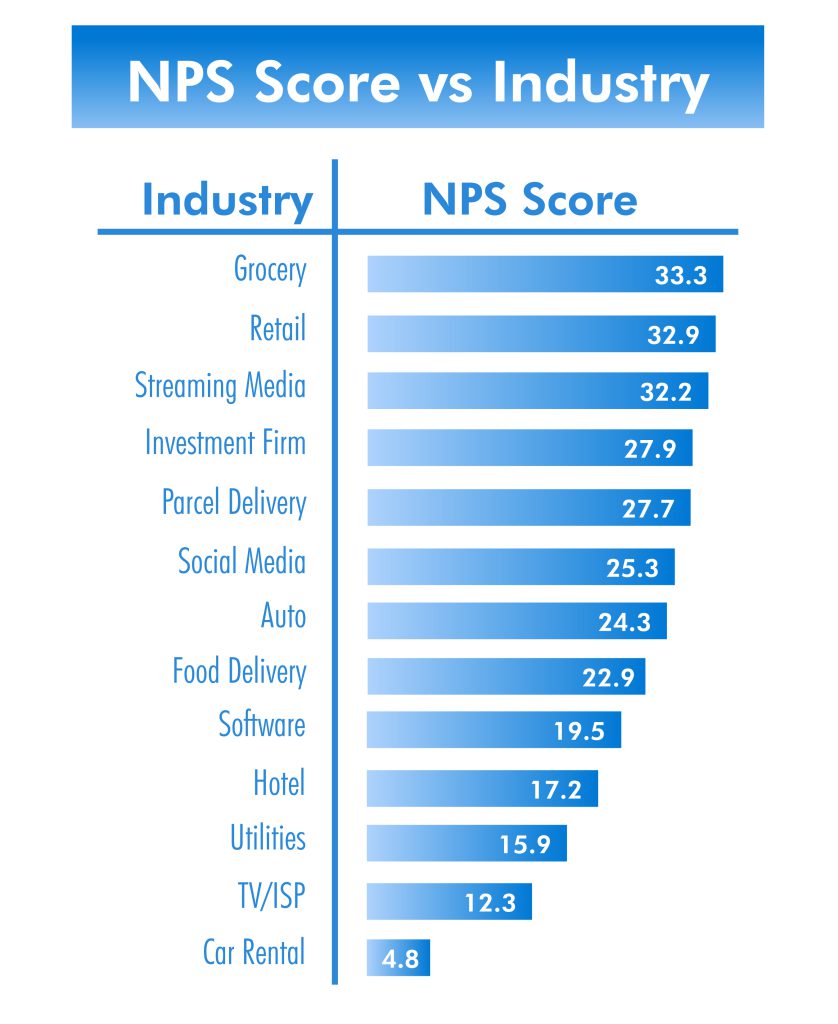
A “good score” is technically anything above 0 as there would be more promoters than detractors. On the other hand, anything less than 0 would be considered a “bad” score, but we have to be mindful of NPS industry averages. An NPS score varies by industry, so you’ll need to search specifically in your industry to get an accurate score.
For example, Airline A has an NPS score of 3, which is technically good but compared to their competitors such as Airline B (NPS score of 41), Airline C (NPS score of 50), and Airline D (NPS score of 77), it needs improvement for that industry.
NPS INDUSTRY AVERAGES
How can Clarity Improve NPS
Clarity is used to identify critical issues with your website and help you prioritize which issues or pain points you should address first to improve your NPS score. Clarity makes it simple to understand user behavior and visualize data with our heatmaps, insights, session recordings, and seamless integration with Google Analytics.
Heatmaps – A Heatmap (or heat map) is a type of data visualization that displays aggregated information in a visually appealing way. User interaction on a website includes clicks/taps, scrolls, mouse movements, etc.
This can improve the NPS score by establishing a benchmark for recent customer experience. Use the heatmap compare feature to see the results of your A/B testing.
Helps identify content trends to see what customers resonate best with, what they click on, and what they scroll to
Allows you to allocate resources to improve low-performing content or web layouts
Clarity Insights – Track what matters to pinpoint where customers are quickly becoming frustrated on your website. Investigate and fix them before it puts a wrench in your NPS score.
Rage Clicks – See where customers repeatedly click. It might be a pain point that hurts the customer experience.
Dead Clicks – See when customers click and nothing happens. It is a good indicator that something might not work on your website.
Quick backs – View how customers click to one page and return right back to the previous page. Maybe the connected content isn’t relevant to the user flow.
JavaScript Errors – Narrow down recordings to sessions with JavaScript errors or image errors. See what the customer did prior and fix the issue.
Session recordings – You found some potential problems using heatmaps and insights, but you still aren’t sure what is going on. Don’t worry! Session recordings allow you to see what exactly happened when the customer visited your site.
This function gives you a first-row seat to how your actual customers are using your website.
The power to see from a different perspective to spark ideas, find errors, and capture areas of opportunity make this a powerful tool to boost your NPS score.
Google Analytics Integration – We know hard it can to work within all these different applications, but with our seamless Google Analytics integration you can see your metrics right inside of Clarity.
Watch recordings for automatically imported Google Analytics segments to understand user behaviors that your team cares the most about.
Improve Google Analytics goals in Clarity and obtain insights into why some users drop off to minimize the number of detractors.
With Microsoft Clarity, you will quickly be able to identify the right questions to ask to get answers. For example, are my customers upset with the company, or are they frustrated with the process of getting the product from the company? Do not let a website take away from your fantastic product, instead use Clarity to wow them with a seamless user experience.
A Clarity Conclusion
NPS is an important metric to use to see what the overall customer sentiment is with a company. You can increase your customer experience, allocate resources, and improve your NPS score with Clarity.
The more promoters you have, the better! Promoters are loyal supporters who promote the product or service on social media and share positive feedback to aid in business growth. They are also likely to purchase from you again if they were satisfied with their experience during the first purchase.
Stop guessing how to improve your customers’ experience—get clarity with Clarity.
Improve the buying experience with Clarity!
Use our insights to wow your visitors and turn them into customers! Free forever!
As a web developer or a website admin, you are probably always on the lookout for new ways you can speed up your website. Not only will a faster website make the experience of your users significantly better, but it will also help you get discovered through better SEO scores. A common source of slowdowns that negatively impact websites is unoptimized scripts, either third-party or first party. For that reason, if you are currently eyeing Clarity as a potential tool, or if you are an old-time Clarity user, you may be wondering: will Clarity slow down my website?
Here at Microsoft Clarity, we are committed to ensuring that our open source instrumentation js client offers the best performance in its class. Our internal benchmarks show that for the vast majority of Clarity users, Clarity has no measurable impact on page load time, but you don’t have to take our word for it! Below we will walk you through the steps on how to measure the impact of Clarity on your website’s performance.
Web Vitals
When discussing website performance, the most widely used metrics are the Web Vitals set of metrics. A website scoring well on its core web vitals will offer a better user experience. The two web vitals that matter the most when discussing Clarity’s impact on page load performance are:
There are plenty of guides on how to optimize your website’s LCP and FID, and what good numbers look like. This article will not focus on how you can improve these measurements, but rather on how to use these measurements to verify Clarity’s performance on your website.
Measuring Web Vitals
The first step towards measuring web vitals is choosing one of the many tools available online that will profile your website for you. These tools offer more objective measurements, compared to measuring web vitals using your own local device. We do not recommend any one in particular, but some of the most popular ones available in no particular order are:
In order to compare your website’s vitals with and without Clarity, you must first measure your website in its current state. Using the tool of your choice, take a few measurements of your website, to establish the baseline numbers of your web vitals. You may also wish to establish numbers for your desktop and mobile experiences separately. Your reports could end up looking something like this:
You should now have a good idea what your numbers look like. You will also notice that many of the online tools show you diagnostic information, and can even suggest improvements to your page. We recommend you apply these improvements in general to improve your page’s performance, but this is not a necessary step for continuing with this article.
Step 2: Create Treatment Measurement
Now that we have a good idea of what your website’s performance looks like, we need to obtain a new set of measurements with Clarity enabled on your website. We recommend you set up a secondary endpoint or use query parameters to generate a version of your website, that has Clarity enabled. An example set up could look like:
This makes it easier to differentiate the measurements.
Again, we recommend you take multiple measurements, for mobile and desktop experiences separately. Your results could look something like:
Once you have your measurements tabulated, its now time to compare numbers!
Step 3: Compare the Web Vital Scores
Comparing the tables of numbers you should have by now will give you a good idea of the performance impact, which for the vast majority of Clarity users is too small to measure in such high level tests. We also recommend you go through the diagnostic information, to verify that Clarity is not showing up as a top level recommendation. Your performance related recommendations could look like this:
You should not find Clarity or any of its resources showing up in your recommendations. If your website is very well-optimized (hats off to you), it may show up as a recommendation with minimal impact. In either of these cases, this confirms that Clarity’s scripts are not slowing your page load.
While have been hard at work here at Clarity to ensure our scripts play nice with every website, framework and browser combination we have been able to find, its still possible that there are cases when Clarity will have a measurable impact on page performance. If you have reason to suspect that this may be true for your website, please contact us through email support@clarity.ms, with as many details as you can gather, so our devs can investigate and resolve the issues.
Have you ever wondered how your site stacks up to others in your industry? Are you ever curious about the average stats across the web? Measuring site performance is crucial for improving your business, but it’s often hard to contextualize what that site performance means -when is good actually “good enough”? How is your site doing competitively… and what investments should you be making?
Introducing Clarity Website Benchmarks – Beta
Clarity Website Benchmarks -Beta is our new interactive tool to answer these questions for you. Get a clear picture of the user behavior and trends across the web. And slice it by site category to see how your website stacks up comparatively.
There are three main ways to use this public report:
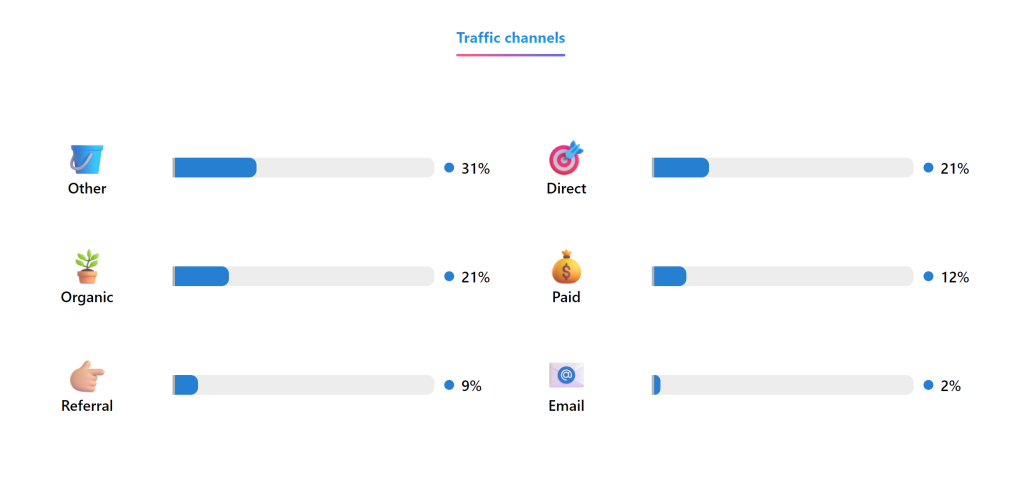
1. See metrics across the general web.
Gauge the average traffic distribution (browser, OS, etc) and average behavioral metrics (rage clicks, quick backs) across the web. Go to the Clarity Website Benchmarks page and scroll down to view these numbers.
Excerpt from the Clarity Website Benchmarks
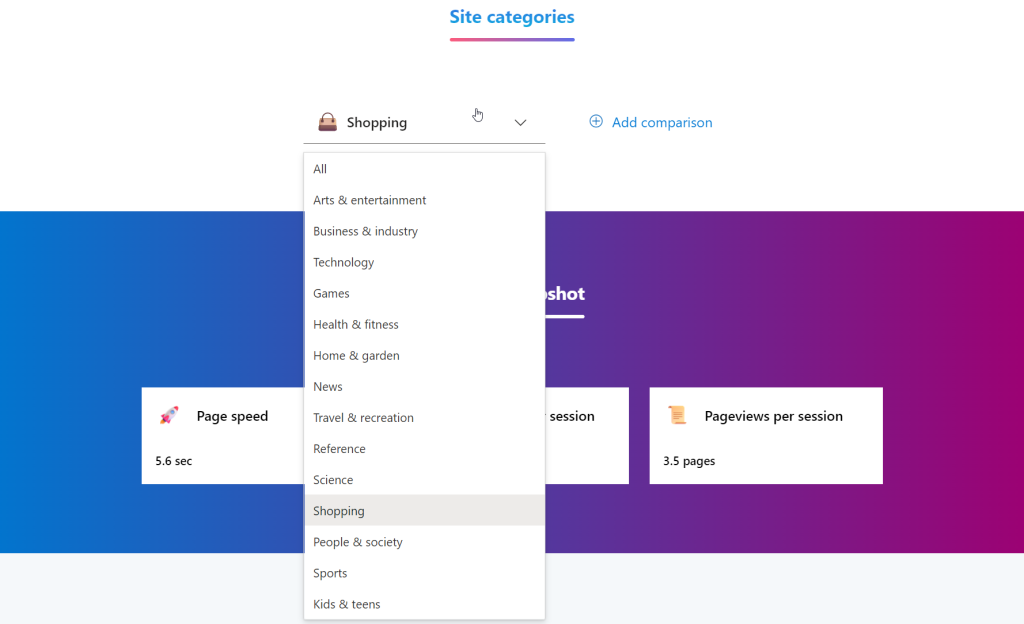
2. See metrics for a certain site category
View the same metrics, but filtered to a specific site category. If you’re an e-commerce website, for example, you may find it helpful to apply the “Shopping” filter. This will show you the average traffic distribution and behavioral metrics across sites that are also classified as e-commerce.
Filter to specific site categories in the Clarity Website Benchmarks
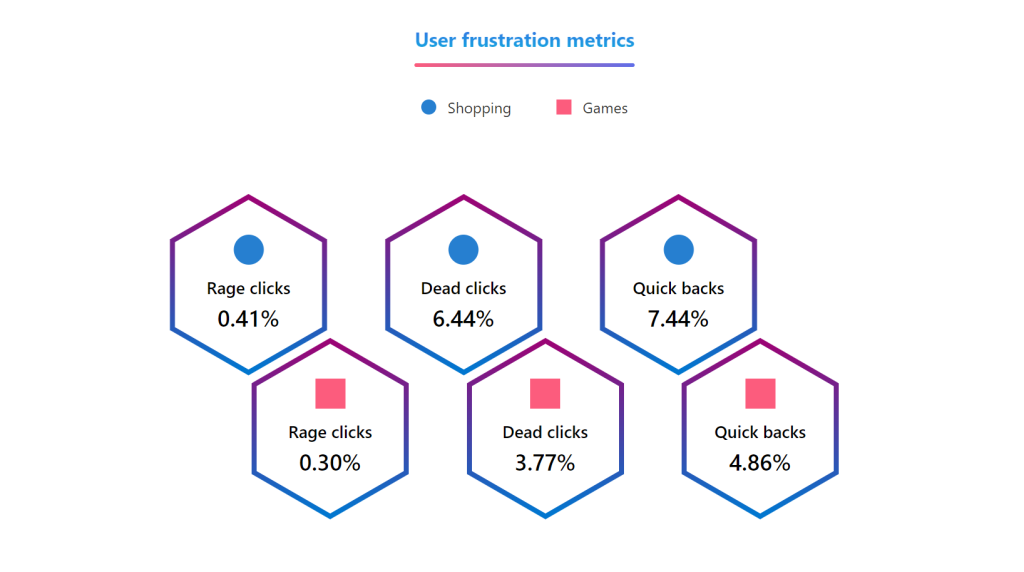
3. Compare two site category metrics
Add a second site category and compare the average stats for two separate site categories. If you’re curious how e-commerce sites and game sites might differ, applying “Shopping” and “Games” filters will show you a side-by-side view of the average stats for each.
Excerpt of Clarity Website Benchmarks, comparing the “Shopping” and “Games” site categories
Where does Clarity get this data from?
This report aggregates data from billions of anonymous Clarity user sessions worldwide. The metrics we surface in the report are the same metrics we provide for Clarity users via our Clarity product dashboard.
What does “Beta” mean?
We released this tool as a Beta version (i.e., an early release before the tool is officially shipped) because we are continuing to improve the quality and coverage of the data. We welcome your feedback as you use this report -let us know what you like and what additional capabilities you would like to see!
We are excited to officially announce and debut our new Clarity app icon which will represent the Clarity brand identity throughout our external facing content, social media channels and on our web pages.


![Clarity vs. Hotjar’s Free Forever Plan [2022]](https://clarity-blog-staging.blog.p.azurewebsites.net/wp-content/uploads/2022/09/MicrosoftTeams-image-2-scaled.jpg)