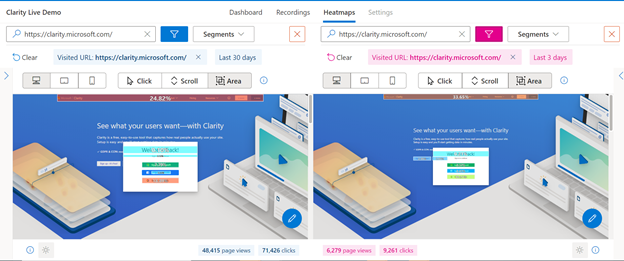
Heatmaps have always been our most popular feature! Our customers love how quickly they can see user behavior without having to dig deep into the numbers. However, a big customer ask has been the ability to compare two heatmaps side by side. Well, our awesome team has been hard at work to deliver this update and today we bring you Compare mode!
Continue reading “See two heatmaps side-by-side with Compare mode”Category: Heat Maps
Introducing Area maps: A new way to see site engagement
During our birthday celebrations, we thought it only right to give our customers a feature they really wanted! Introducing – Area maps!
So, what exactly are Area maps?
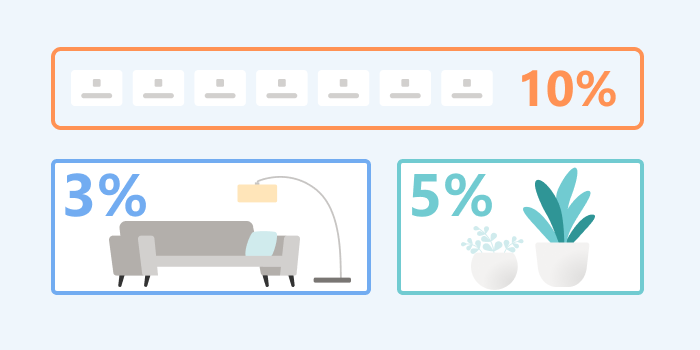
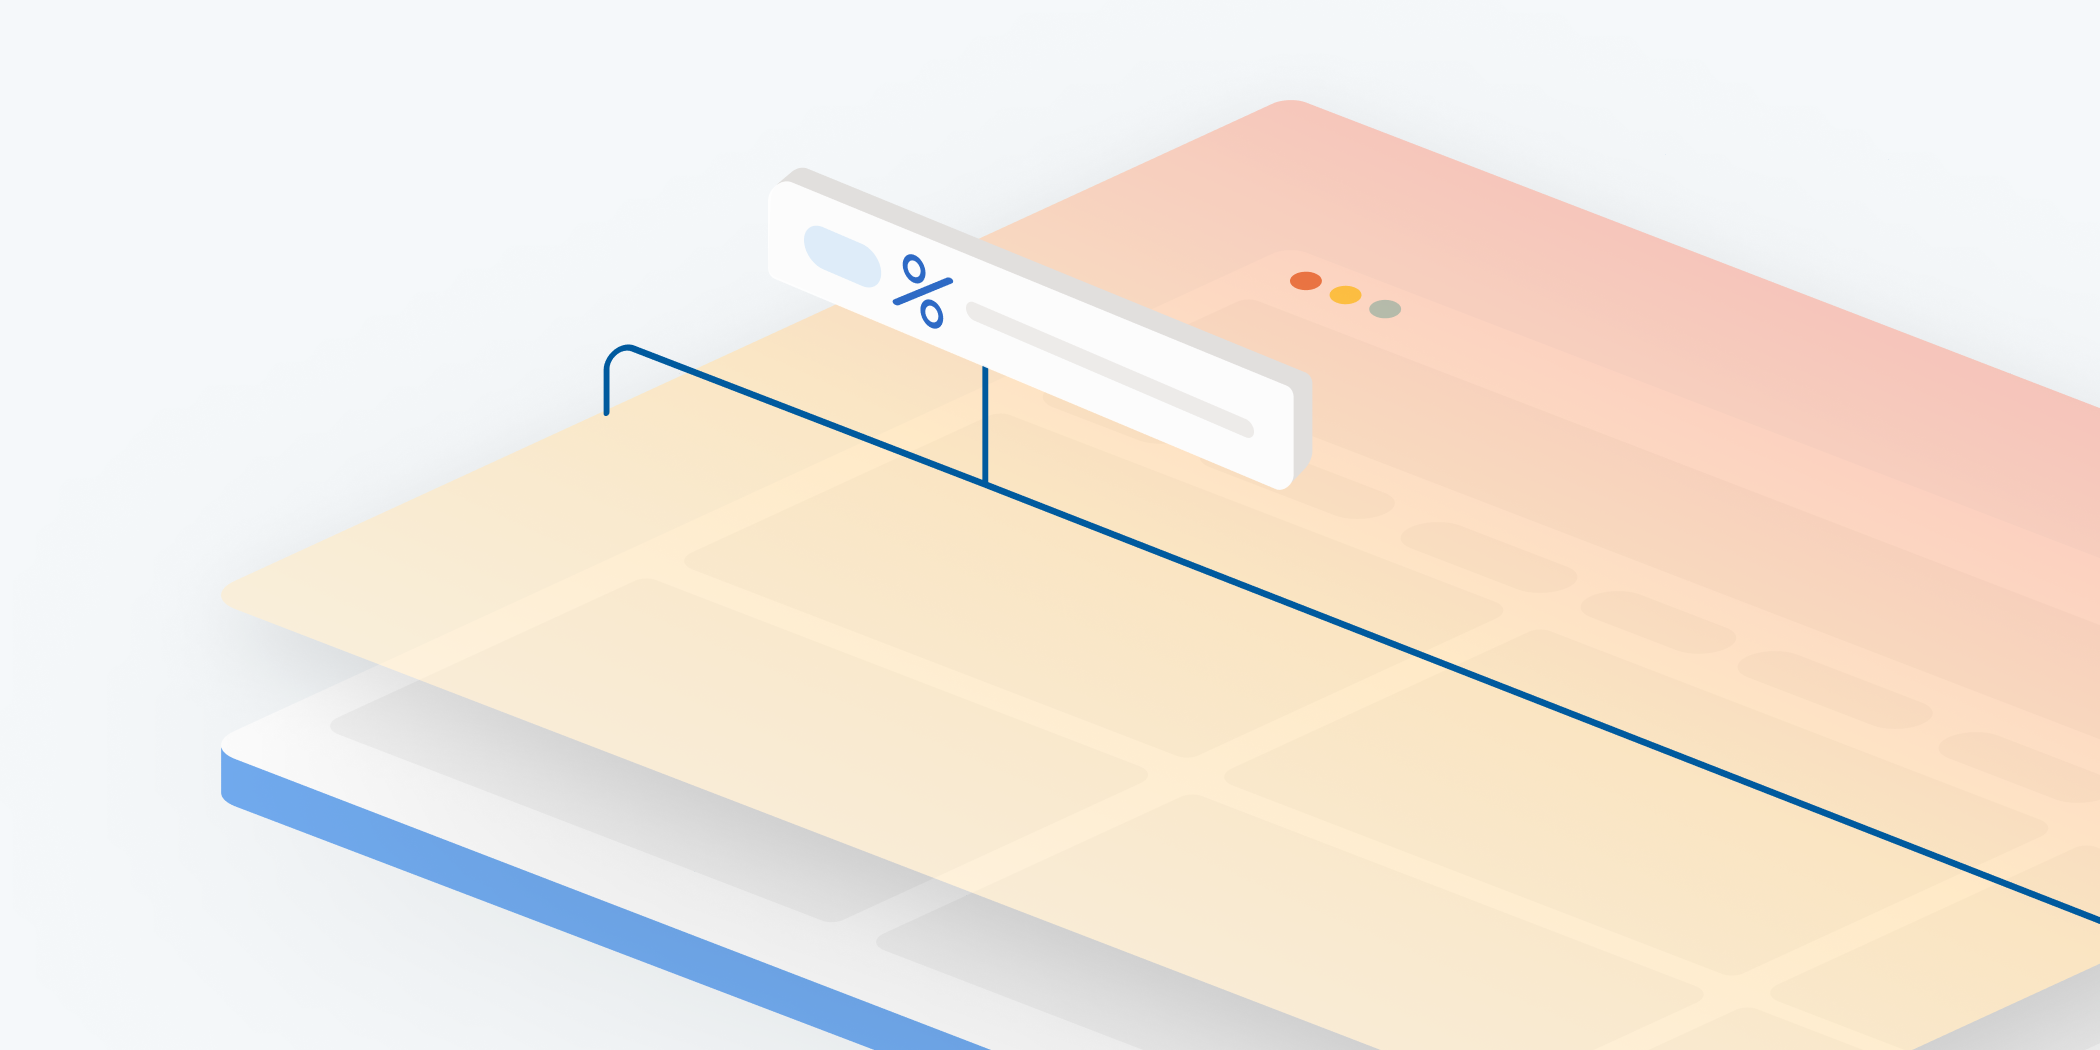
Area map is a new type of heatmap that shows you the total clicks for all the elements within a selected area you choose.
We show this in 2 ways:
- First by color
- Second by percentage
This makes it very easy to see if the right elements on your page are getting the desired attention.
How does this differ to a Click map?
A Click map shows you where users clicked on the page using coordinates on the x-axis and y-axis. Whereas an Area map shows the total clicks for all the elements within an area you choose. We wanted to make it easier for our customers to choose areas they care about and aggregate the clicks for all elements within it.
Let’s take a look at an example
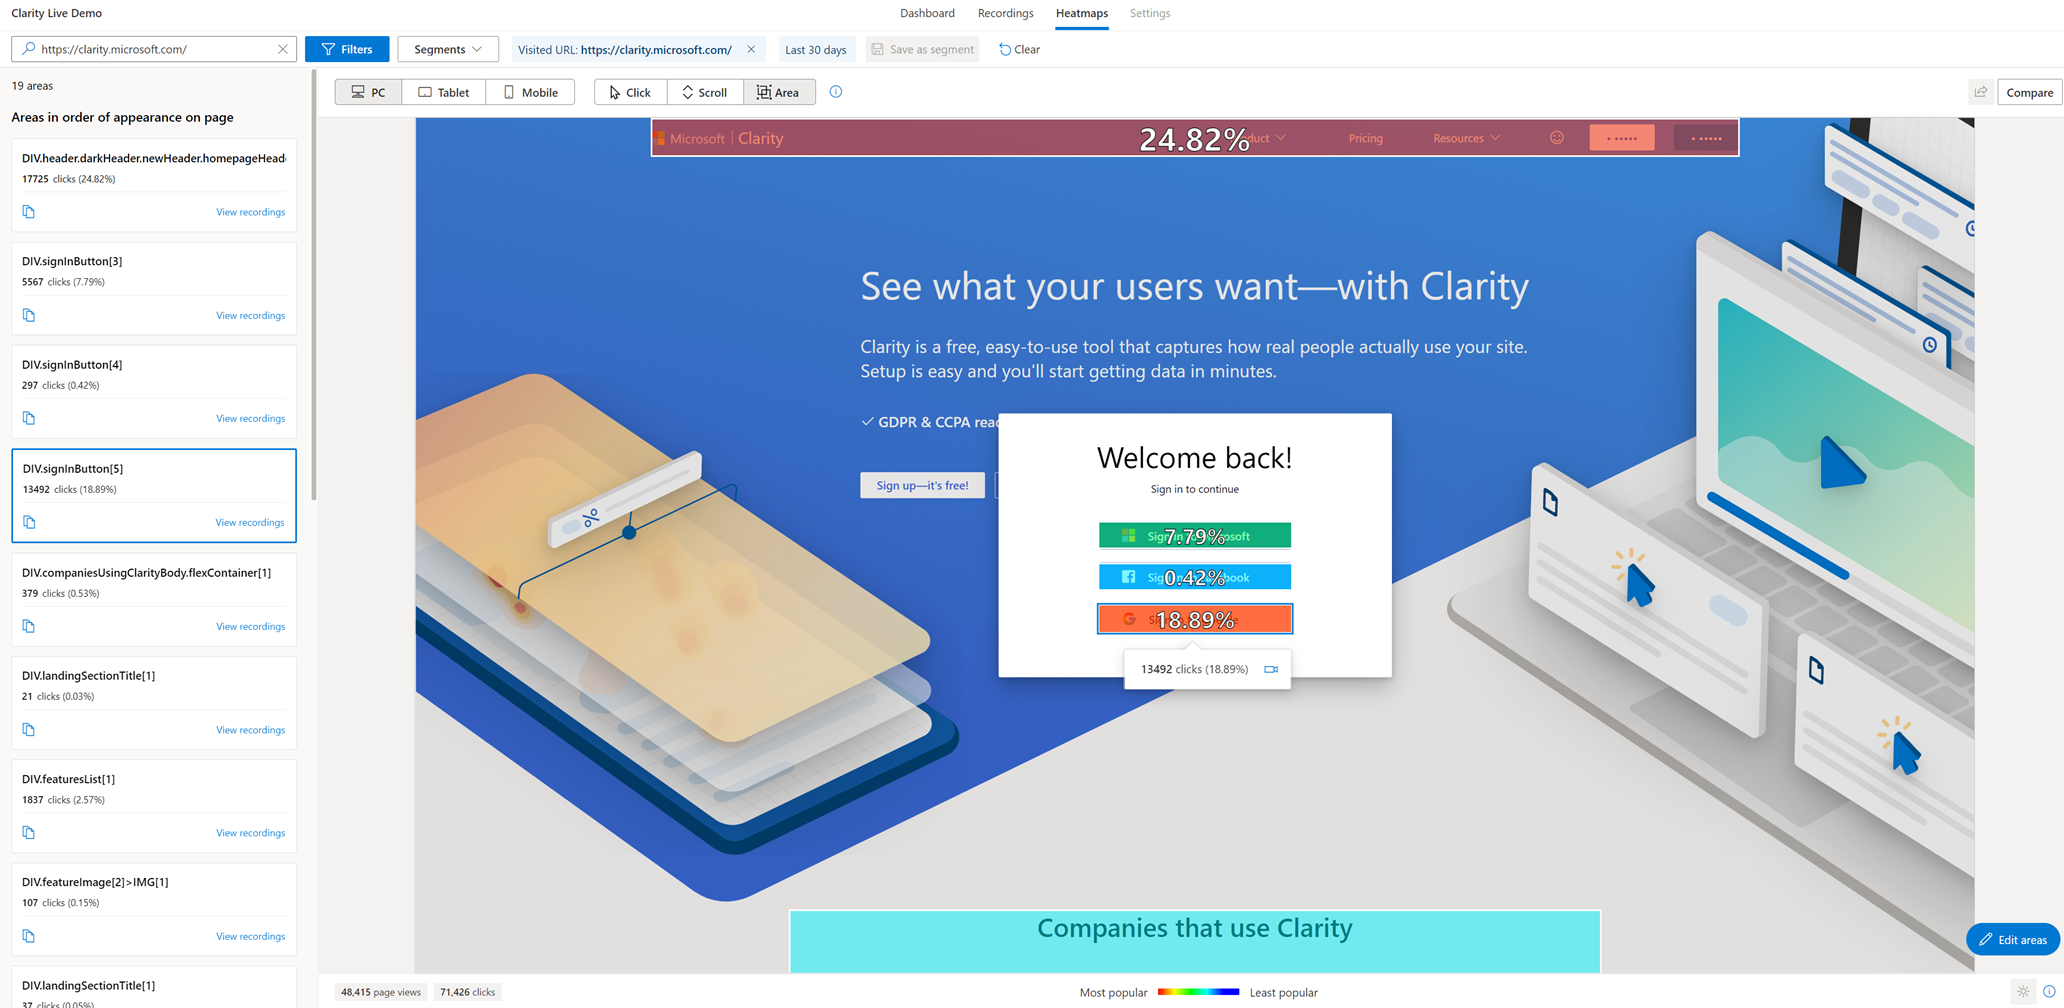
The image below shows our homepage.
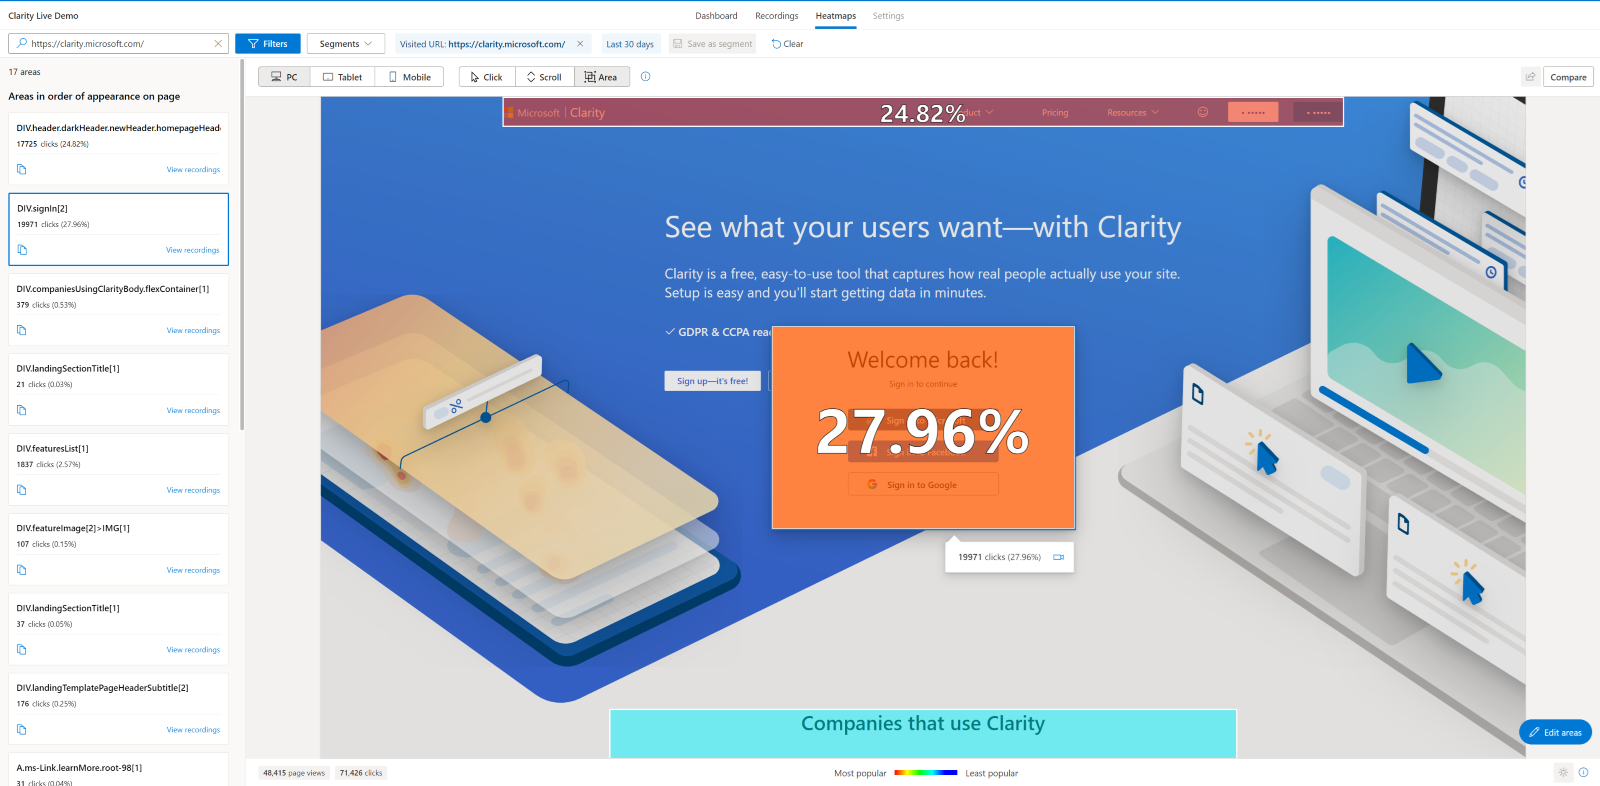
We can easily see that across the last 30 days nearly 28% of visitors have gone to complete the sign-in process. That’s excellent information for sure!
But what if we wanted to dig deeper and see which sign-in method has been the most popular?
Easy, we can select edit area and drill down to each sign-in element.
We can now see which of the given sign-in options is the most popular!
Digging even further, in the future we could AB test different orders using our upcoming new feature, heatmap compare to see if changing the order has any impact on customer behavior.
So there you go! Area maps are here! We are pretty sure this will become a firm favorite with customers.
Clarity heatmaps just got better: Watch recordings inline!
Heat maps or Heatmaps are a great way for you to analyze aggregated information on users’ interactions with your website. At a glance, you can quickly see which elements on your site are the most engaged and which aren’t.
Continue reading “Clarity heatmaps just got better: Watch recordings inline!”Mastering Microsoft Clarity Heatmaps: Insights and Best Practices
What is a Heatmap?
A heatmap is a way of showing aggregated data in a visual way. It uses colors to show different levels of user activity on a website, such as clicks, scrolls, mouse movements, etc. Warmer colors (reds) show higher activity while cooler colors (blues) represent lower activity. There are three main types of heatmaps within Clarity: click, scroll, and area. Each one gives a unique insight into how users behave on a website.
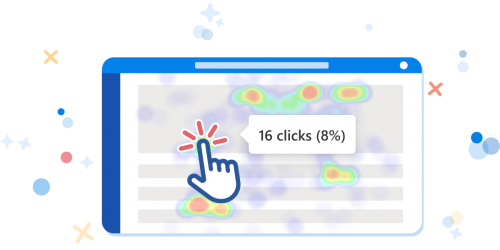
Click Heatmaps
Click heatmaps help you understand the critical content on the page. They allow you to identify parts of the page design where your users are clicking and help determine what users may mistake for links. On PC, Clarity tracks your user clicks and on mobile or tablet, Clarity tracks your user taps. You can also view click maps for a single page or group of pages.

Scroll Heatmaps
Scroll heatmaps indicate how far users scroll on average. This data helps determine whether your users see the most important content and indicates where to put your essential calls to action. As you hover over the Scroll map, you can view the exact % of users who reached that point of your webpage or group of pages. It displays the Average fold which indicates the average location visible on a webpage before the user starts scrolling. Scroll maps are useful for longer, text-based content. If users aren’t scrolling past the first few paragraphs, you might want to move important information higher up on the page.

Area Heatmaps
Area Maps show the number of clicks across different, editable, regions of your webpage. You can easily see the number of clicks within an area as well as the click through rate, which represents the percentage of all clicks that occurred in the area. Unlike a click map, you can choose the area and view the heat for all the elements within the area.

Across each of the heatmaps, you can toggle between the different devices that Clarity supports such as: desktops, tablets, and mobile devices.
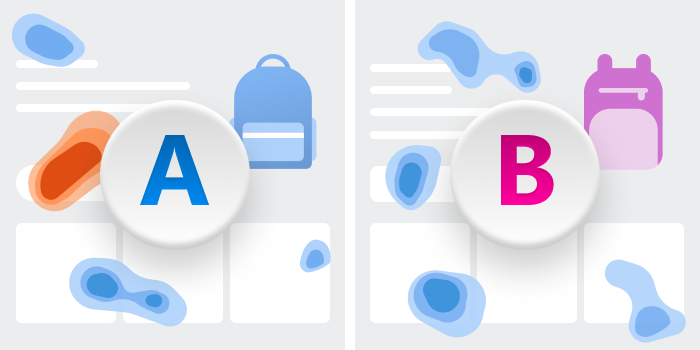
You can also compare two heatmaps side by side. This is perfect for A/B testing, as it allows you to visually assess which design changes drive more engagement.

Another useful feature is switching screenshots. You can switch between different screenshots of the same heatmap to see how user interactions vary across different versions of your page. This feature is particularly useful for analyzing dynamic content and ensuring consistent user experience. For instance, see how a seasonal promotion affects user behavior compared to your standard layout.

How is a Heatmap Generated?
Heatmaps are generated from aggregated data, and understanding how this data is aggregated is crucial for interpreting the heatmap representation.
Traditionally, click heatmaps record the X and Y positions of mouse clicks. All clicks at those coordinates contribute to the heat intensity, which is then overlaid on a static website representation. However, this method doesn’t scale well for varying screen resolutions, dynamic HTML elements, single-page apps, or dropdown menus.
In contrast, Clarity employs an advanced process with intelligent HTML element detection based on a website’s DOM. For click maps, Clarity identifies clicks on specific tags, CSS classes, and parent nodes, aggregating them by element. This approach allows heatmaps to be drawn relative to these elements rather than X/Y coordinates. For scroll maps, Clarity considers page length and user scrolling across multiple pages.
Notably, Clarity’s heatmaps are dynamic, displaying interactions based on elements existing at different points in time. This flexibility enables visualization of clicks during various stages of a page’s existence.
5 Key Takeaways from Heatmaps
1. Heatmaps can help you measure how your visitors’ experiences change when you update your site.
Keep track of progress by comparing your visitors’ experiences on your site before and after making changes. This will help you understand the impact of your site improvements and updates.
2. Heatmaps can help you find out what content your visitors like best.
Understand your visitors’ favorite content over time so you can give them more of what they want and less of what they don’t.
3. Heatmaps can help you design better website layouts.
Design more effective website layouts by letting heatmaps tell you how each element on your page ranks in its user engagement.
4. Heatmaps can help you prioritize what to fix when you have limited resources.
Make decisions to prioritize issues that have the greatest impact on user experience and sales conversion.
5. Heatmaps can show you the results of experiments on your site.
With heatmaps, you don’t have to guess about which A/B test performs higher, they visualize it for you.
Microsoft Clarity Heatmaps provide invaluable visual representations of user interactions, shedding light on where users click, move their cursors, and scroll. Clarity’s heatmaps are generated on the fly, with no creation delay, and return within seconds. They aggregate data to quantify behaviors and trends, helping you identify what content works best for your website or app. Plus, Clarity is free forever, making it an accessible tool for understanding user behavior.
Add Clarity to your site today!
Use our insights and analytics to wow your website visitors!
Scroll map – what can it do for you?
Scroll map – one of the most popular heatmaps types provided by Clarity.
Continue reading “Scroll map – what can it do for you?”Clarity click maps – what can they do for you?
You have probably heard that to be successful you need to be data-driven, only if it was that simple. Collecting data is the easy part; figuring out what matters and how to use this information to your advantage is a lot more difficult. Here to save the day are click maps!
Continue reading “Clarity click maps – what can they do for you?”