For our fourth release of the week, we bring you exporting. The ability to export your recordings data to excel and download your Heatmaps and Dashboard for viewing offline.
Continue reading “Clarity now supports exporting”Author: Clarity Staff
Optional bio.
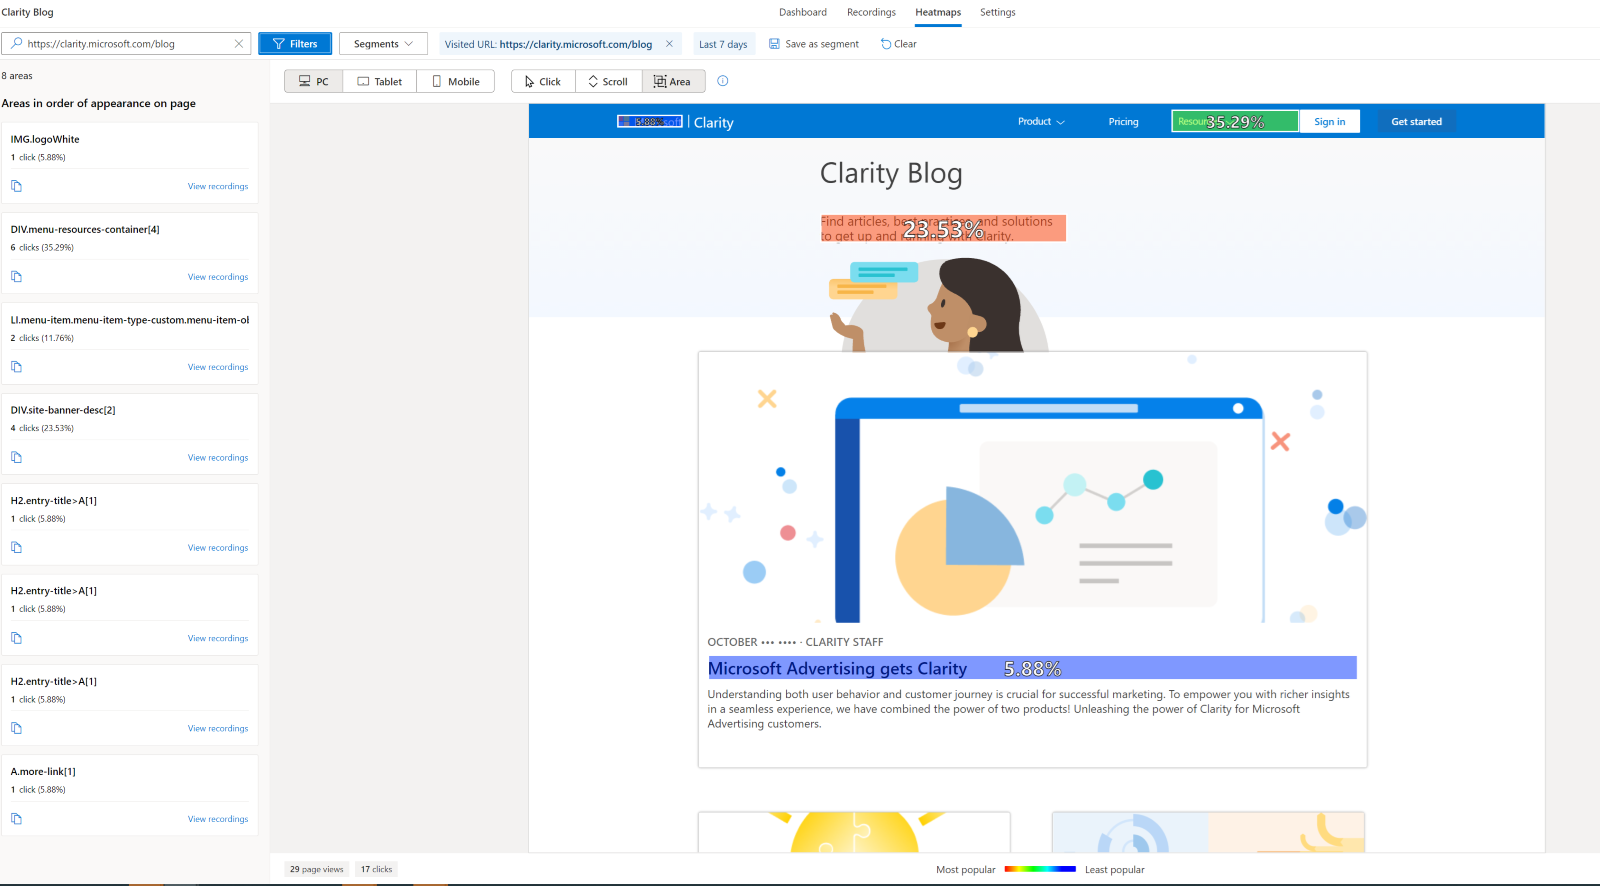
Clarity launches Content Insights for blogs!

Have you ever wondered if users find your content interesting? Do you want to know which articles make readers browse more on your site? In addition, what’s the overall site experience for a user who abandons right after reading just the headline?
Continue reading “Clarity launches Content Insights for blogs!”A year of Clarity
As we mark our 1st birthday, we wanted to take a moment to share how far we have come, what we have learned, and what we have in-store…
Continue reading “A year of Clarity”See two heatmaps side-by-side with Compare mode
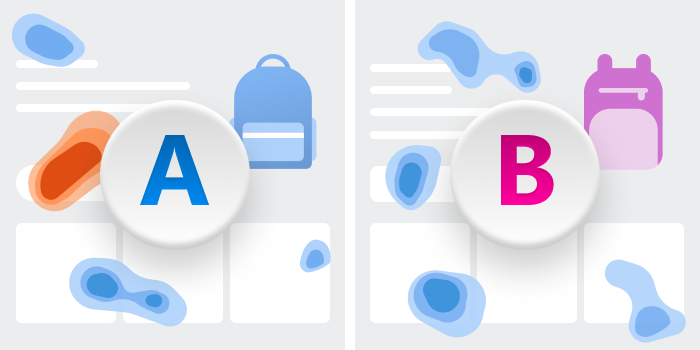
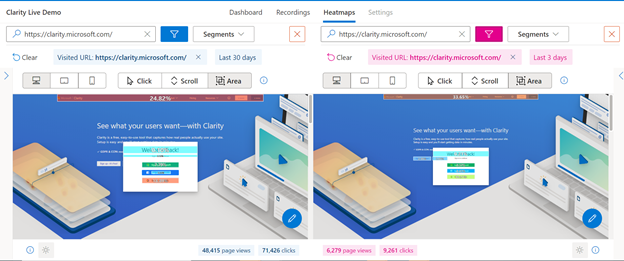
Heatmaps have always been our most popular feature! Our customers love how quickly they can see user behavior without having to dig deep into the numbers. However, a big customer ask has been the ability to compare two heatmaps side by side. Well, our awesome team has been hard at work to deliver this update and today we bring you Compare mode!
Continue reading “See two heatmaps side-by-side with Compare mode”Introducing Area maps: A new way to see site engagement
During our birthday celebrations, we thought it only right to give our customers a feature they really wanted! Introducing – Area maps!
So, what exactly are Area maps?
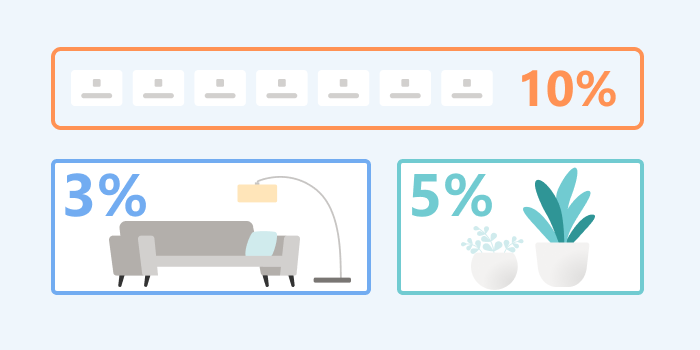
Area map is a new type of heatmap that shows you the total clicks for all the elements within a selected area you choose.
We show this in 2 ways:
- First by color
- Second by percentage
This makes it very easy to see if the right elements on your page are getting the desired attention.
How does this differ to a Click map?
A Click map shows you where users clicked on the page using coordinates on the x-axis and y-axis. Whereas an Area map shows the total clicks for all the elements within an area you choose. We wanted to make it easier for our customers to choose areas they care about and aggregate the clicks for all elements within it.
Let’s take a look at an example
The image below shows our homepage.
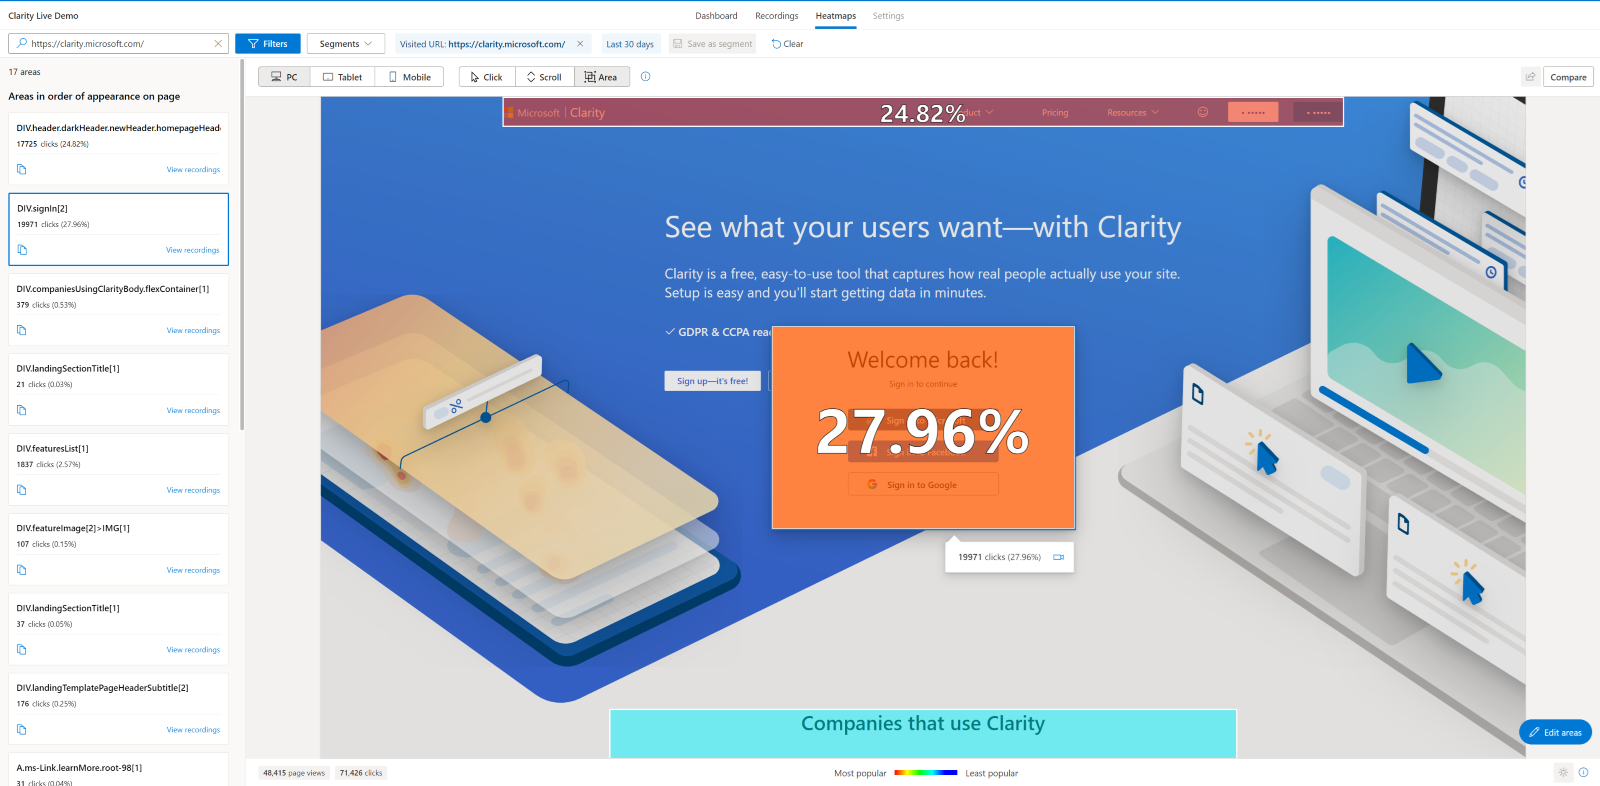
We can easily see that across the last 30 days nearly 28% of visitors have gone to complete the sign-in process. That’s excellent information for sure!
But what if we wanted to dig deeper and see which sign-in method has been the most popular?
Easy, we can select edit area and drill down to each sign-in element.
We can now see which of the given sign-in options is the most popular!
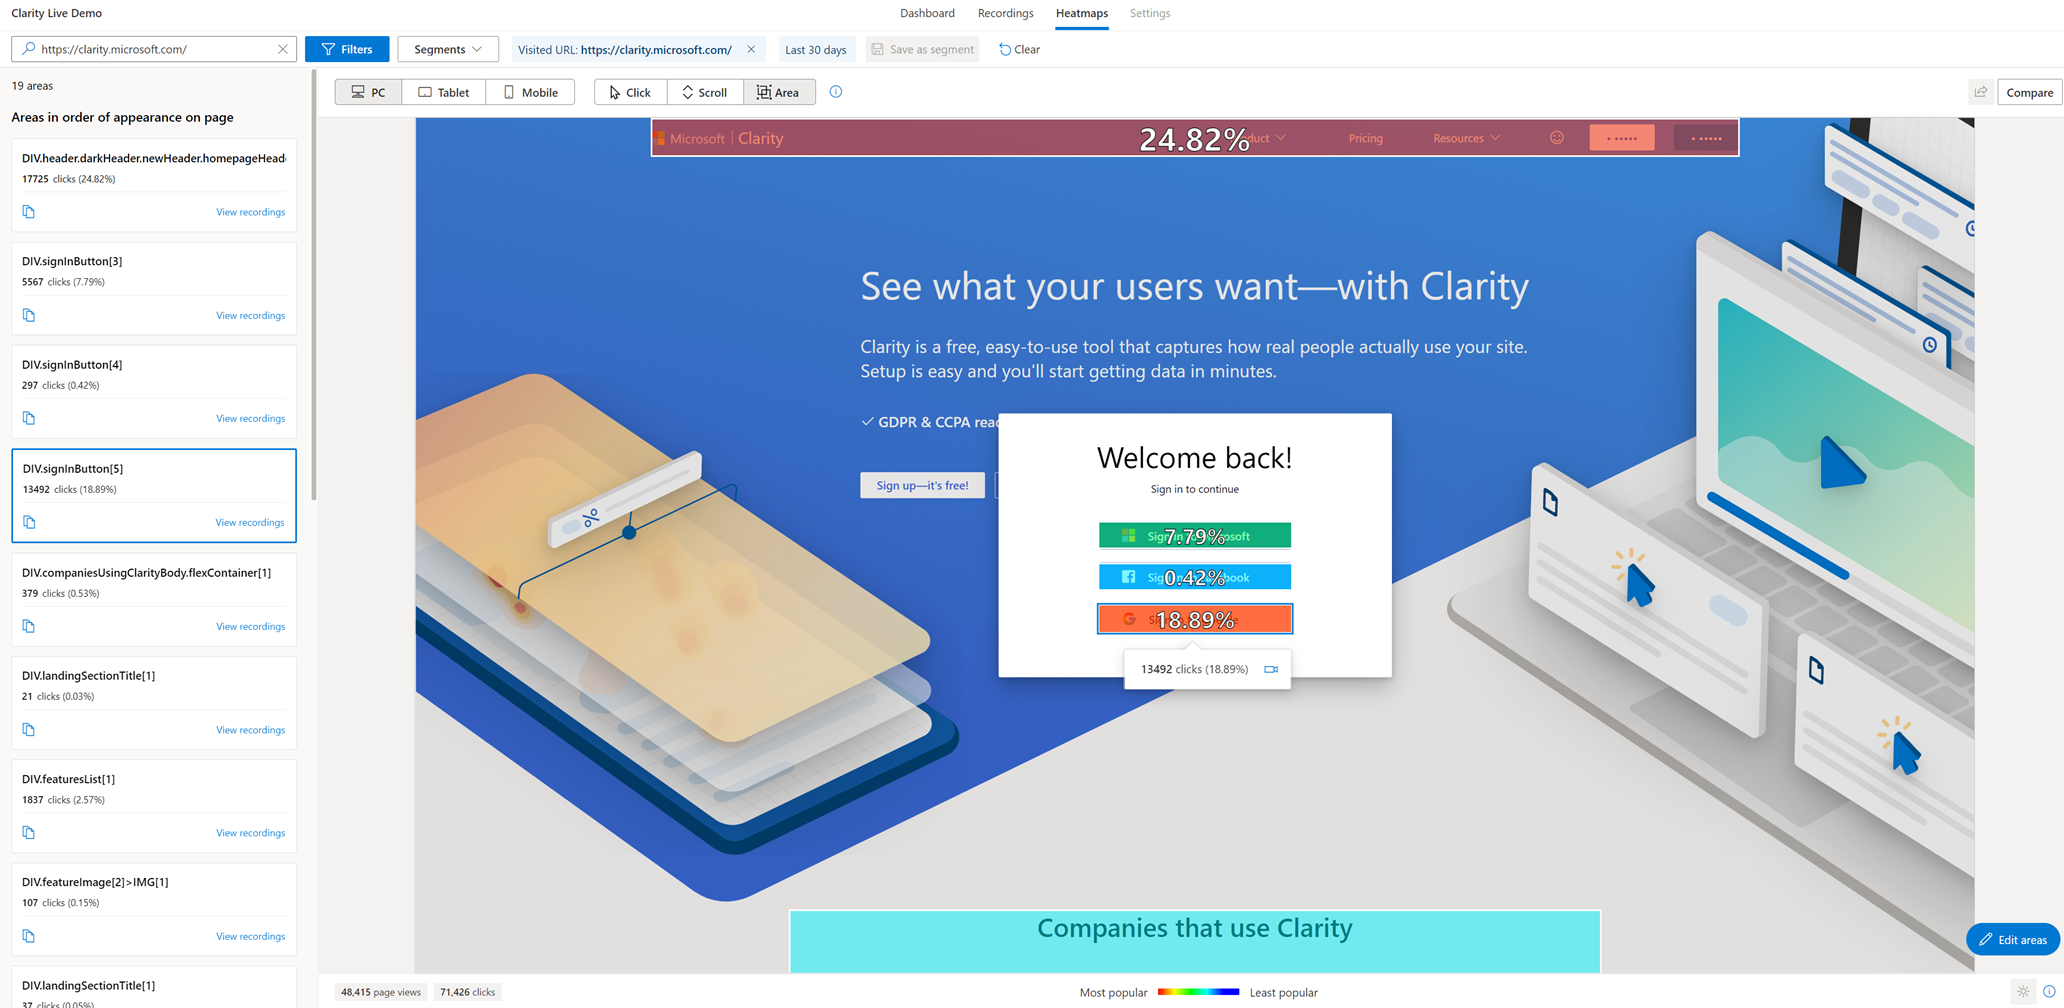
Digging even further, in the future we could AB test different orders using our upcoming new feature, heatmap compare to see if changing the order has any impact on customer behavior.
So there you go! Area maps are here! We are pretty sure this will become a firm favorite with customers.
More e-commerce insights

Back in September, we launched insights for our e-commerce customers! Today we add to those features with a new widget and more e-commerce filters for any website using Product JSON-LD.
Continue reading “More e-commerce insights”Microsoft Advertising gets Clarity
Understanding both user behavior and customer journey is crucial for successful marketing. To empower you with richer insights in a seamless experience, we have combined the power of two products! Unleashing the power of Clarity for Microsoft Advertising customers.
Continue reading “Microsoft Advertising gets Clarity”Announcing Clarity Case Studies

We wanted to share all the awesome successes our customers are having using Clarity! From our hot heatmaps to our scintillating session recordings our growing list of features gives our customers the insight they need to make decisions, fix bugs, improve usability, and a whole lot more!
Continue reading “Announcing Clarity Case Studies”All the insight, now in sight. See your Google Analytics dashboard with Clarity!

At Clarity one of our aims is to make it easy for our users to access and view insight that is important to them! We understand that learning a new system, naming conventions, etc., can be hard! So naturally, it made sense for us to deeply integrate Google Analytics data into Clarity – Introducing Google Analytics dashboard in Clarity!
Continue reading “All the insight, now in sight. See your Google Analytics dashboard with Clarity!”Clarity for a Software Engineer

A software engineer is a person whose job is to design, develop, maintain and test computer software. Our team at Clarity relies heavily on our engineering team to bring cool ideas to life for our customers to enjoy. As users of Clarity, the engineering team utilizes it every day to make sure these features run smoothly and are bug-free!
Continue reading “Clarity for a Software Engineer”Clarity for a Product Manager
We aren’t just the creators of Clarity, we are also users! All of our team use Clarity to drive decisions, create new features, fix bugs, design UX, and deliver wonderful customer experiences.
Today we caught up with our forever busy Product Manager, Priyanka Ved – AKA “The Glue”. She took time out of her packed schedule to tell us about how she uses Clarity to get things done!
Continue reading “Clarity for a Product Manager”Session Recordings now bring the Heat(maps)!
Clarity session recordings are awesome and super helpful! They allow you to analyze your users’ behavior right from the start of their visit to the moment they leave. This is a great way to really understand what a user does on your website.
Continue reading “Session Recordings now bring the Heat(maps)!”