Supercharge Your CRM: Unlock Game-Changing Insights with Clarity + HubSpot

Supercharge Your CRM: Unlock Game-Changing Insights with Clarity + HubSpot

In the fast-paced world of CRM, having a complete view of your contacts’ journeys is essential. Microsoft Clarity’s Smart Events Integration with HubSpot brings website behavior data into your HubSpot dashboard, enabling you to track and analyze key user interactions directly within your CRM. This enhanced integration bridges the gap between website analytics and customer relationship management, giving your team actionable insights to refine user experiences and increase engagement. 

What Are Smart Events?

Smart Events are designed to capture specific user interactions on your website by combining multiple data signals into high-level user actions. These can include key events such as “Purchase,” “Contact Us,” or “Add to Cart.” 

👉 Learn more about Smart Events by visiting our documentation.

Key Features of the HubSpot Integration Enhancements

This integration bridges the gap between Smart Events and HubSpot, delivering a more efficient way to analyze user behavior. The benefits include:

  • Real-Time User Tracking: Instantly access smart events and corresponding session moments within HubSpot for faster decision-making. 

How to Use the Integration

Install and Configure:

➡️ Ensure the Clarity tracking code is added to your website.

➡️ Connect your Clarity project to your HubSpot account.

Access Smart Events in HubSpot:

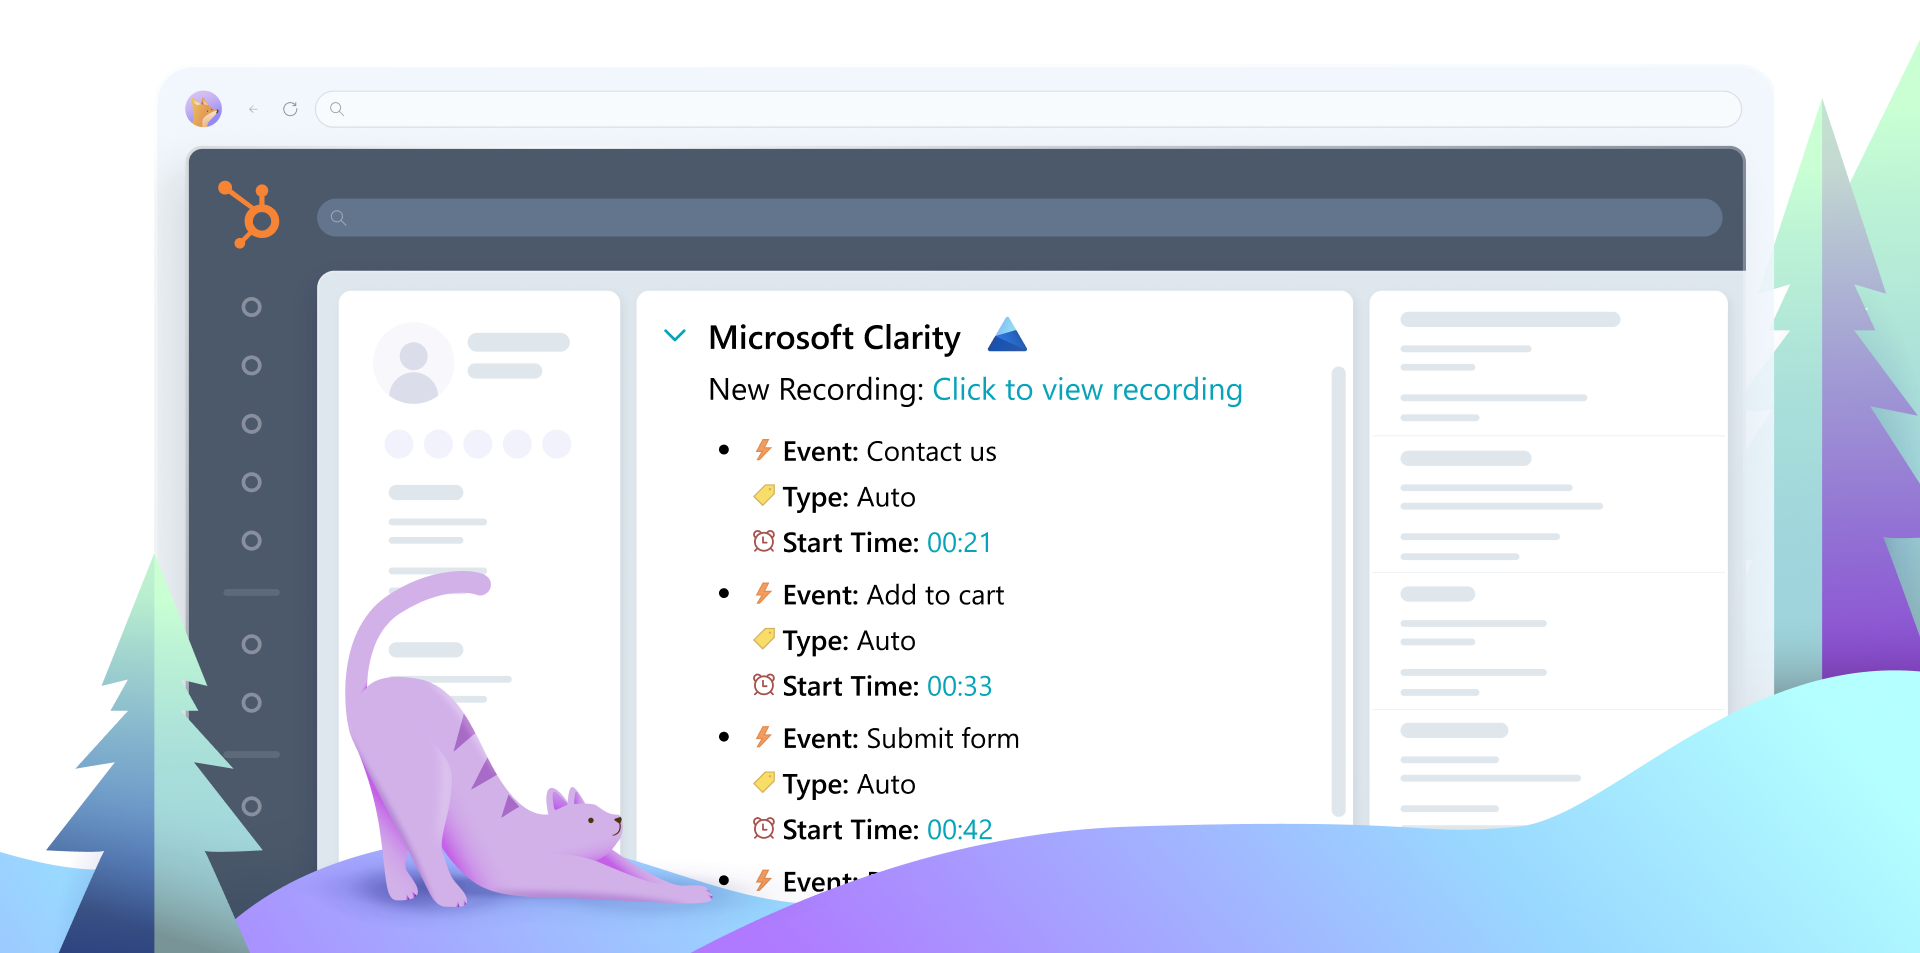
  1. Access the contact list and select the record of the contact whose data you wish to view. In the activity section, you can examine the smart events listed within HubSpot by expanding the Clarity timeline event card allowing you to explore both predefined and customized events. 
  2. Click on a smart event to view the Clarity recording, with the timeline highlighting the exact moment the event occurred. 

Analyze and Optimize:

  • Use these insights to understand user paths that lead to conversions or drop-offs. 
  • Identify friction points in your user experience and address them effectively. 
  • Make data-driven design and content improvements to enhance engagement and drive better conversions. 

Why Use Smart Events + Hubspot Integration?

This integration offers a powerful combination of predictive analytics for UX and streamlined workflows. Smart events Integration with HubSpot delivers clear advantages:

  • Streamlined Analysis: Access direct links to session recordings for faster insights. 
  • Pattern Recognition: Identify trends and behaviors that impact user experience. 
  • Actionable Insights: Turn data into meaningful improvements that enhance business outcomes. 

The enhanced smart events Integration with HubSpot makes it easier than ever to unlock the potential of your user behavior data. Log in to your Microsoft Clarity account to explore the integration today. For additional tips and guidance, visit our Smart Events Overview.

Enhance your ability to understand user behavior and take your website optimization to the next level with Microsoft Clarity. 

Get Started Today!

Watch Now: Navigating the Google Analytics Dashboard in Microsoft Clarity

Watch Now: Navigating the Google Analytics Dashboard in Microsoft Clarity

Unlock the power of Google Analytics with Microsoft Clarity! Learn how to seamlessly integrate GA with Clarity, connect your account, and explore key reports like Audience Overview and Acquisition. Plus, gain deeper insights with Clarity’s heatmaps and session recordings to better understand user behavior and optimize your site effectively.

Discover how to streamline your data analysis and get a complete view of your site’s performance. Learn more by watching the video below

Don’t forget to subscribe to our YouTube channel and follow us on social so you know when our next video will drop! 

Enjoy!

5 Reasons to Fall in Love with Clarity Mobile SDK

5 Reasons to Fall in Love with Clarity Mobile SDK

Mobile app functionality is becoming increasingly sophisticated, and the market is flooded with SDKs designed to enhance apps. However, not all SDKs are created equal. In this blog, we’ll explore why the Clarity Mobile SDK stands out as a top choice for mobile app analytics and how it can benefit your app.

What is Clarity Mobile SDK?

The Clarity Mobile SDK is a lightweight, high-performance software development kit that delivers in-depth analytics and insights for mobile apps. With Clarity, developers can monitor user behavior, diagnose performance issues, and improve overall app experiences. It supports:

Native Platforms: Android and iOS

Cross-platform Frameworks: React Native, Cordova/Ionic

🌟 Coming Soon: Flutter 🌟 

Why SDK Selection Matters for Your App?

Integrating the wrong SDK can harm your app’s performance. Poorly designed SDKs may cause slower performance, bugs and glitches, increased crashes and reduced functionality. These issues can lead to user churn and negative reviews. In contrast, a high-quality SDK like Clarity can boost key metrics, including, user retention, engagement and revenue.

👉 Pro Tip: Check out our guide to the top 5 analytics SDKs in the market for a detailed comparison.

5 Reasons to Choose Clarity Mobile SDK

1. Lightweight and Efficient: Clarity’s small footprint ensures that it doesn’t slow down your app:

  • Android SDK Size: 417KB
  • iOS SDK Size: 977KB

2. Easy Implementation: Integrating Clarity can take just a few minutes. Developers have reported the full integration taking no longer than 20 minutes.

👉 Check out our integration guide here.

3. Free and Unlimited: Clarity is completely free with no hidden fees. Every session is analyzed without sampling, offering comprehensive insights.

4. Customer Love: since its launch in 2022, Clarity SDK has achieved:

  • 100% Year-Over-Year Growth
  • 1.6M+ Customers across web and mobile platforms

🔍 Read our customer success stories for more details.

5. Privacy and Data Protection: Clarity prioritizes compliance and security:

  • GDPR & CCPA Compliant
  • Automatic Input Masking
  • Customizable Masking Modes: balanced, relaxed, and strict masking modes. Screen masking for sensitive areas (e.g., payment screens) is also included.

Key Performance Metrics of Clarity SDK

➡️ Memory Usage: Clarity consumes less than 50 MB of memory on Android devices.

➡️ CPU Usage: ~5% increase at the 95th percentile during peak usage.

➡️ Network Consumption: 10KB per recorded second.

Ready to Optimize Your App?

Don’t wait to enhance your app’s analytics and performance. Install Clarity SDK today and experience the difference firsthand!

Watch Now: An Overview of the Settings Page in Microsoft Clarity

Watch Now: An Overview of the Settings Page in Microsoft Clarity

Explore the Microsoft Clarity Settings Page and learn how to manage project details, set up team roles, integrate with Google Analytics and Tag Manager, and configure privacy features like masking and IP blocking. Discover how to customize your setup and explore integrations to enhance your Clarity experience!

Get the most out of your Clarity settings by learning more here:

Don’t forget to subscribe to our YouTube channel and follow us on social so you know when our next video will drop! 

Enjoy!

Uncover Hidden Insights: Introducing Inactive Pages in Microsoft Clarity

Uncover Hidden Insights: Introducing Inactive Pages in Microsoft Clarity

We are thrilled to announce a new feature for Microsoft Clarity:  Inactive Pages. This new feature will help you identify pages on your website that have not been visited in the past 12 months, providing valuable insights that are currently only available through expensive SEO tools.  

What are Inactive Pages?  

Inactive Pages are defined as pages on your website that have not received any visits in the past 12 months. Identifying these pages can help you understand which parts of your site are underperforming or no longer relevant to your audience.  

Note: Inactive pages are only available for projects with sitemaps 

Why Inactive Pages Matter  

Understanding Inactive Pages is crucial for several reasons:  

  • Uncovered Analytics Area: This is a significant area in analytics that is not covered by any behavioral analytics tool. Traditionally, only SEO tools have provided this information.  
  • Cost Savings: Website owners often pay substantial amounts to auditors and tools to get this information. With Clarity, you can access it easily and for free.  

Benefits of Using Inactive Pages in Clarity  

  • Optimize Content: Identify and remove or update underperforming pages to improve overall site performance.   
  • Improve SEO: Boost search engine rankings by eliminating outdated or irrelevant pages, consolidating valuable content, and ensuring a streamlined site structure that search engines can easily crawl.  
  • Enhance User Experience: Focus on content that matters to your users, ensuring a more engaging and relevant experience.   
  • Save Costs: Reduce the need for expensive third-party tools and auditors by leveraging Clarity’s built-in capabilities.   
  • Increase Engagement: By addressing inactive pages, you can ensure your site remains dynamic and engaging, leading to higher user retention and satisfaction.   

How to Get Started  

Getting started is simple:  

  1. Create a Clarity project  
  1. Access Inactive Pages Report: Navigate to the Inactive Pages section in your Clarity dashboard.  
  1. Analyze Data: Review the list of pages that have not been visited in the last 12 months.  
  1. Take Action: Decide whether to update, remove, or repurpose these pages based on their relevance and performance.  

Default tab: If you would like to set inactive pages as the default tab, go to Card data -> Customize dashboard -> Select default tab. Choose Inactive pages. 

For more details, check our documentation.

Conclusion  

The Inactive Pages feature is a game-changer for website analytics, providing valuable insights that were previously difficult and costly to obtain. Try it out now and see how it can help you optimize your website and enhance user engagement!

Watch Now: How to Use the Microsoft Clarity Data Export API

Watch Now: How to Use the Microsoft Clarity Data Export API

The Data Export API lets you download Clarity dashboard data automatically, allowing for deeper analysis and integration with applications. Whether you’re evaluating a website redesign or measuring a marketing campaign’s impact, this API brings Clarity insights directly into your dashboard.

Unlock the power of data with Microsoft Clarity’s Data Export API!

Make the most of Clarity’s Data Export API by learning more here:

Don’t forget to subscribe to our YouTube channel and follow us on social so you know when our next video will drop! 

Enjoy!

Introducing Attention Maps: Unlock Deeper Insights with Microsoft Clarity

Introducing Attention Maps: Unlock Deeper Insights with Microsoft Clarity

Understanding user behavior is critical for optimizing your website’s performance. Microsoft Clarity’s new Attention Maps feature offers a fresh perspective on how visitors interact with your pages, helping you fine-tune your user experience and maximize engagement.

What Are Attention Maps?

Attention Maps visualize where users spend the most time on your webpage. By highlighting sections with warmer or cooler colors, they reveal which parts of your content captivate your audience’s attention and which areas may need improvement. This granular insight helps you answer key questions like:

  • Are users engaging with the most important elements on your page?
  • Are visitors missing critical CTAs or information?

These insights empower data-driven decisions, from tweaking content placement to refining page layouts.

Key Features of Attention Maps

Attention Maps provide detailed metrics that bring clarity to user engagement patterns:

  • Average Time Spent: Measure the average time users spend on specific parts of your page. Hover over any section to get precise data.
  • Percentage of Session Length: Understand how long users focus on a section relative to the overall session length.
  • Heatmap Visualization: Warmer colors indicate more time spent, while cooler colors show areas with less time spent.

How to Use Attention Maps

  1. Install the Clarity Tracking Code: Ensure the Clarity tracking code is installed on the pages you want to analyze. Follow the Setup Process for step-by-step guidance.
  2. Access Attention Maps: Navigate to the Heatmaps section in your Clarity dashboard and select Attention Maps. Use the left-hand panel to explore data such as:
    • % Scrolled: View page sections based on scroll depth.
    • Avg Time Spent: Identify areas where users spend the most time.
    • % of Session Length: Assess user focus relative to the total session.
  3. Analyze and Optimize:
    • Focus on sections with cooler colors to improve visibility or time spent.
    • Test layout changes to direct attention toward high-priority elements like CTAs or key content.

Why Use Attention Maps?

Whether you’re optimizing an e-commerce product page, refining your blog layout, or improving form submissions, Attention Maps provide actionable insights to:

  • Enhance page usability
  • Boost conversions
  • Drive better outcomes for your business

Enhance Your Understanding with Clarity’s Heatmaps

Attention Maps are part of Clarity’s robust Heatmap suite, which also includes Click Maps and Scroll Maps. Together, these tools offer a comprehensive view of user interaction, enabling you to craft experiences that resonate with your audience.

Get Started Today

Ready to uncover what truly holds your audience’s attention? Sign in to your Microsoft Clarity account and explore Attention Maps now. For more tips on maximizing your insights, check out our Heatmap FAQ and Heatmaps Overview.

Unlock Deeper Insights with Microsoft Clarity’s Google Ads Integration

Unlock Deeper Insights with Microsoft Clarity’s Google Ads Integration

The new Google Ads integration with Microsoft Clarity, first launched in private preview in December 2024, is now generally available to all users! This integration connects Google Ads performance metrics with Clarity’s behavioral insights, offering a comprehensive way to analyze and optimize advertising campaigns. 

Beyond Metrics: Understanding User Behavior

By combining Google Ads data with Clarity’s rich behavioral analytics, you can move beyond surface-level metrics to truly understand user behavior after ad clicks. View session recordings to observe how visitors navigate your site and explore heatmaps to visualize engagement patterns. These insights help identify friction points, optimize landing pages, and refine strategies to boost conversions. Understanding user behavior allows you to take targeted actions to reduce drop-offs and enhance return on ad spend (ROAS)

Key Features of the Integration

The integration links Google Ads campaign-level data with Clarity’s behavioral insights. Key features include:

  • Viewing session recordings and heatmaps at the campaign level
  • Filtering Clarity dashboards by Google Ads campaigns
  • And monitoring Google Ads metrics like:
    • Impressions
    • Click-Through Rates (CTR)
    • Cost-Per-Click (CPC)
    • Cost-Per-Action (CPA)
    • and Conversion Rates (CVR)

How Clarity Enhances Campaign Optimization

By leveraging Clarity’s advanced tools, advertisers can achieve:

  1. Heatmap Comparisons: Identify high-engagement elements to replicate success.
  2. Session Replay Summaries: Save time with streamlined analysis.
  3. Funnel and Smart Event Comparisons: Detect conversion issues with precision.
  4. A/B Testing Insights: Determine the best-performing variations for campaigns.
  5. Performance Troubleshooting: Diagnose issues such as slow page load times.

These features not only support Conversion Rate Optimization (CRO) but also enhance user experience and increase the likelihood of desired actions.

How to Get Started

Getting started with the integration is quick and simple:

  1. Ensure you have an active Clarity project.
  2. Go to Settings > Integrations in your Clarity dashboard.
  3. Link your Google Ads account.

Once connected, your Google Ads data will seamlessly integrate with Clarity’s behavioral insights, providing a holistic view of your ad performance.

👉 Visit the Clarity Documentation for detailed setup instructions.

Empower Smarter Marketing Decisions

This integration simplifies ad performance analysis, enhances user engagement insights, and empowers smarter marketing decisions. Try the Google Ads integration today and transform your marketing strategies! 

Stay tuned for updates as we continue expanding Clarity’s capabilities to unlock deeper advertising insights!

👉 Sign up for Microsoft Clarity here.