One of the benefits of Clarity is being able to dial in the interface to fit your needs when it comes to analytics, reporting and visualizations. We are excited to highlight the “Custom user ID” feature which enhances Clarity’s capabilities even further.
You might be familiar with the “Clarity user ID,” a generic user ID assigned to each visitor when they come to your site. This ID gets assigned to features like screen recordings and it is possible to filter by, however it isn’t consistent across browsers and devices.
Custom user IDs on the other hand can help you stitch together your users’ sessions across devices, browsers, and more! For example, if a user visits your site through mobile and desktop, or even two different browsers, you’ll be able to see their journey across all on the visitor profile. Visitor profiles shown below, provide a detailed and organized display of information about your users, all in one place. Learn more about visitor profiles here.
Using a custom identifier can help you view more unified and complete user journeys when performing a user-level-based analysis and is useful for debugging, investigating patterns, and examining data based on specific customers.
Custom identifiers are nothing but informational data values about site visitors that are sent to Clarity by your client-side code over its Identify API. Custom user ID is just one of those identifiers and is configurable under the custom-id key-value pair. Other custom identifiers include custom-session-id and custom-page-id. Learn more about custom identifies and our API visit here.
All values provided and transmitted over the Identify API get securely hashed on the client before being sent to Clarity servers. For example, you could decide to send across a user’s email address or their respective customer loyalty ID as a custom-id and Clarity would ensure that this information remains protected and confidential. For an optimal use of custom-id, the Identify API should be called for each page of the website even if you choose not to pass other identifiers, such as custom-session-id or custom-page-id.
Tip: Use unique custom user IDs for authenticated users. Sending static strings for all authenticated users is undesired and makes custom user IDs useless. For unauthenticated users, either don’t use the API or set the ID to ‘unknown,’ ‘not logged in,’ or ‘0.
Below you can see the filter fields which will allow you to filter by custom IDs. You can also learn more about filters here or watch our YouTube video here.
We hope this feature highlight will allow you to better track and interpret your customer data. As always if you have any feedback please reach out to us at msclarity@microsoft.com!
How Microsoft Clarity Minimizes Impact on Core Web Vitals
A common source of slowdowns that negatively impact websites are unoptimized third-party or first party scripts. For that reason, if you are currently considering Clarity or if you are a long-time Clarity user, you may be wondering: will Clarity slow down my website?
The Clarity team measures the performance impact of Clarity js across all the domains that uses Clarity and monitors to ensure performance impact is minimized. Our internal benchmarks show that for the vast majority of Clarity users, Clarity has no measurable impact on page load time. Below we will walk you through how to measure the impact of Clarity on your website’s performance.
What are Core Web Vitals and why are they important?
Core Web Vitals are a set of metrics introduced by Google to measure the quality of user experience on a webpage. They focus on three key aspects:
Largest Contentful Paint (LCP): Measures loading performance. It tracks how long it takes for the largest content element (like an image or text block) to become visible within the viewport. A good LCP score is 2.5 seconds or less
Interaction to Next Paint (INP): Assesses interactivity. It measures the time from when a user first interacts with a page (like clicking a button) to the time when the page responds. A good INP score is 200 milliseconds or less1
Cumulative Layout Shift (CLS): Evaluates visual stability. It measures how much the page layout shifts unexpectedly during loading. A good CLS score is 0.1 or less
These metrics are important because they directly impact user experience. Pages that load quickly, respond promptly to user interactions, and remain visually stable are more likely to keep users engaged. Additionally, Google uses Core Web Vitals as part of its ranking algorithm, meaning that better scores can improve your site’s visibility in search results
What is INP?
INP is a metric that assesses a page’s overall responsiveness to user interactions by observing the latency of all clicks, taps, and keyboard interactions that occur throughout the lifespan of a user’s visit to a page. The final INP value is the longest interaction observed, ignoring outliers. A low INP score indicates that the page consistently responds quickly to user interactions, enhancing the overall user experience.
Why is INP important?
This metric is particularly important for several reasons:
User Experience: blogs often feature rich media content like high-resolution images, videos, and interactive elements. A fast INP ensures that users can interact with these elements smoothly, enhancing their overall experience on the site.
Engagement: A responsive website encourages users to stay longer and explore more content. For bloggers, this means readers are more likely to browse through content, watch videos, and engage with blog posts, which can lead to higher engagement rates.
SEO Benefits: Search engines like Google consider web performance metrics, including INP, when ranking websites. A better INP can improve a blog’s search engine ranking, making it more visible to potential readers
Monetization: Many bloggers monetize their content through ads, affiliate links, and sponsored posts. A faster, more responsive site can lead to higher ad impressions and click-through rates, boosting revenue.
Brand Reputation: A well-performing website reflects positively on the blogger’s brand. It shows professionalism and attention to detail, which can help build trust and loyalty among readers.
By focusing on improving INP, bloggers can create a more enjoyable and efficient experience for their audience, ultimately benefiting their blog’s success and growth.
How does Clarity minimize impact on web vitals?
From its inception, Clarity was engineered to have minimal impact on website performance. Today it is trusted by millions of websites to track their analytics, and performance is taken very seriously by our users. To deliver on our minimal impact guarantees, Clarity leverages:
Optimized bundle sizes
CDNs, caches and high-performance servers
Intelligent DOM crawling
Continuous monitoring of Clarity’s web vitals impact on each individual website using performance focused flighting
The Clarity team measures the performance impact of Clarity js across all the domains that uses Clarity.
How to verify that Clarity does not affect Core Web vitals?
Measuring Web Vitals
The first step towards measuring web vitals is choosing one of the many tools available online that will profile your website for you. These tools offer more objective measurements, compared to measuring web vitals using your own local device. some of the most popular ones are:
Once you have chosen a tool or a selection of tools, we are ready to begin benchmarking.
Step 1: Create Baseline Measurement
To compare your website’s vitals with and without Clarity, you must first measure your website in its current state. Using the tool of your choice, take a few measurements of your website to establish the baseline numbers of your web vitals. You may also wish to establish numbers for your desktop and mobile experiences separately. Your reports could end up looking something like this:
You should now have a good idea what your numbers look like. You will also notice that many of the online tools show you diagnostic information and can even suggest improvements to your page. We recommend you apply these improvements in general to improve your page’s performance, but this is not a necessary step for continuing with this article.
Step 2: Create Treatment Measurement
Now that we have a good idea of what your website’s performance looks like, we need to obtain a new set of measurements with Clarity enabled on your website. We recommend you set up a secondary endpoint or use query parameters to generate a version of your website, that has Clarity enabled. An example set up could look like:
This makes it easier to differentiate the measurements.
Again, we recommend you take multiple measurements, for mobile and desktop experiences separately. Your results could look something like:
Once you have your measurements tabulated, it’s now time to compare numbers!
Step 3: Compare the Web Vital Scores
Comparing the tables of numbers you should have by now will give you a good idea of the performance impact, which for the vast majority of Clarity users is too small to measure in such high level tests. We also recommend you go through the diagnostic information, to verify that Clarity is not showing up as a top level recommendation. Your performance related recommendations could look like this:
You should not find Clarity or any of its resources showing up in your recommendations. If your website is very well-optimized (hats off to you), it may show up as a recommendation with minimal impact. In either of these cases, this confirms that Clarity’s scripts are not slowing your page load.
Conclusion
Microsoft Clarity helps minimize impact on web vitalsby providing insights into user behavior through features like heatmaps, session recordings, and user engagement metrics. These tools allow developers to identify and address issues that cause delays in user interactions, such as long tasks or inefficient code, thereby improving the page’s responsiveness.
No team and/or product is perfect. If you have reason to suspect that Clarity is slowing down performance for your website, please contact us via email at clarityms@microsoft.com, with as many details as you can gather, so our devs can investigate and resolve the issues.
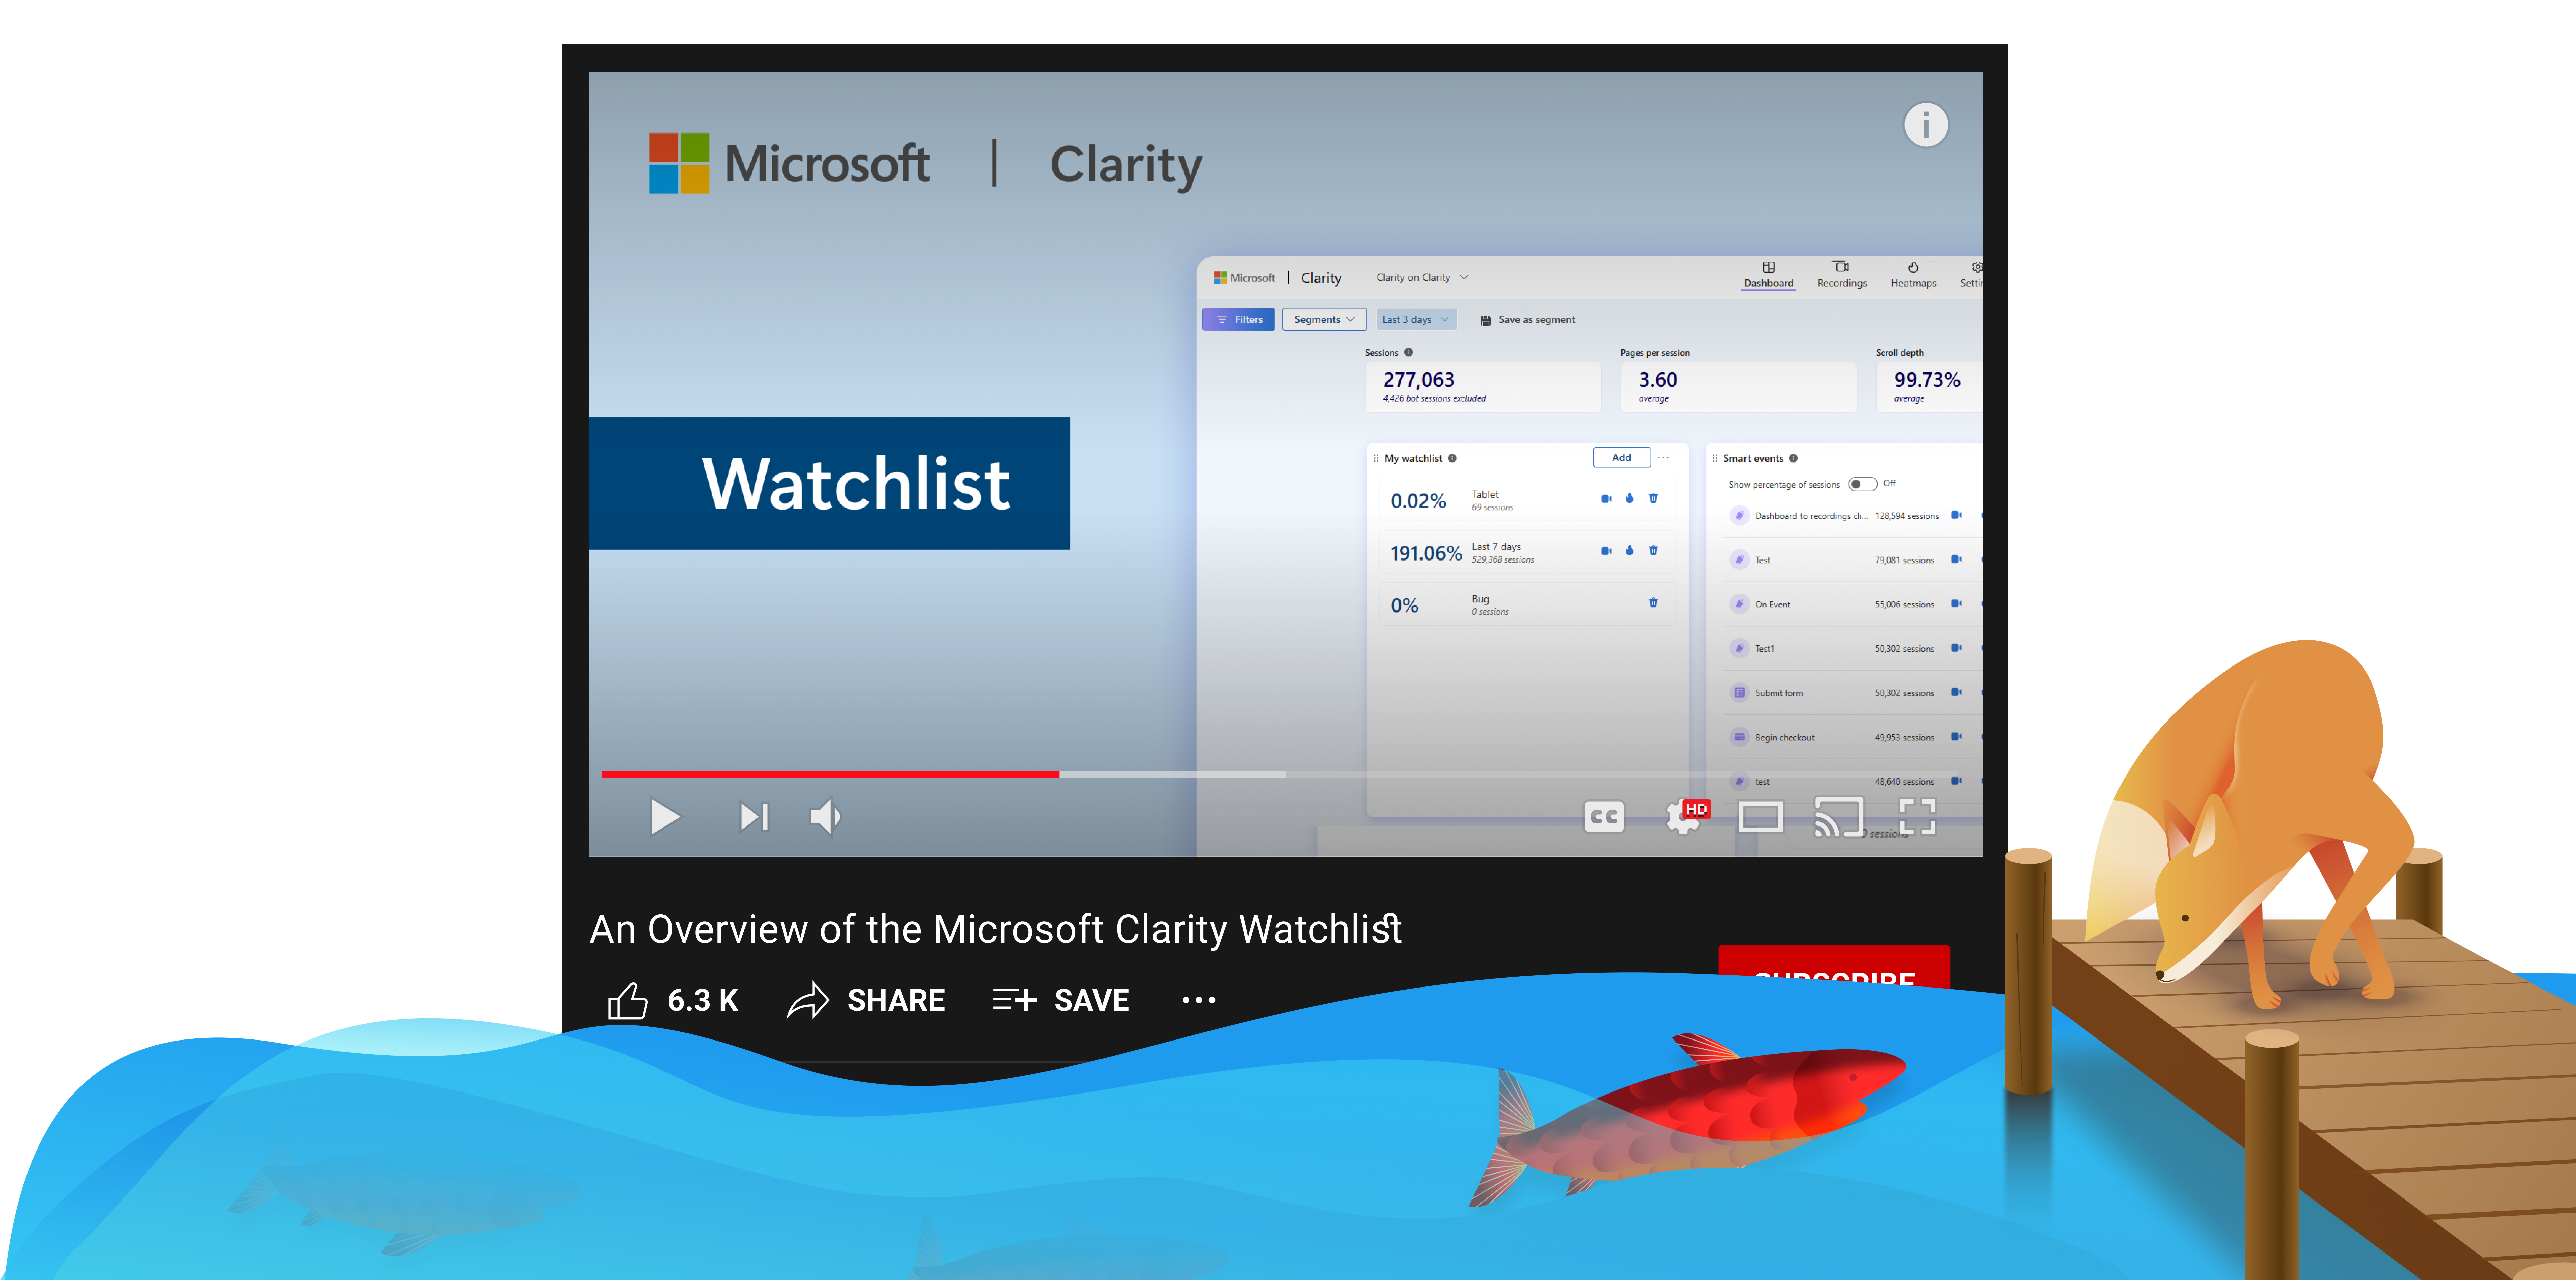
Now Playing: An Overview of the Microsoft Clarity Watchlist
Keep your data insights at your fingertips with Microsoft Clarity’s Watchlist!
Easily track key segments, labels, and custom tags to focus on the user interactions that matter most. Whether you’re growing mobile users in the UK or monitoring a campaign, Watchlist makes it simple.
Learn how to set it up by watching the video below!
Don’t forget to subscribe to our YouTube channel and follow us on social so you know when our next video will drop!
Enjoy!
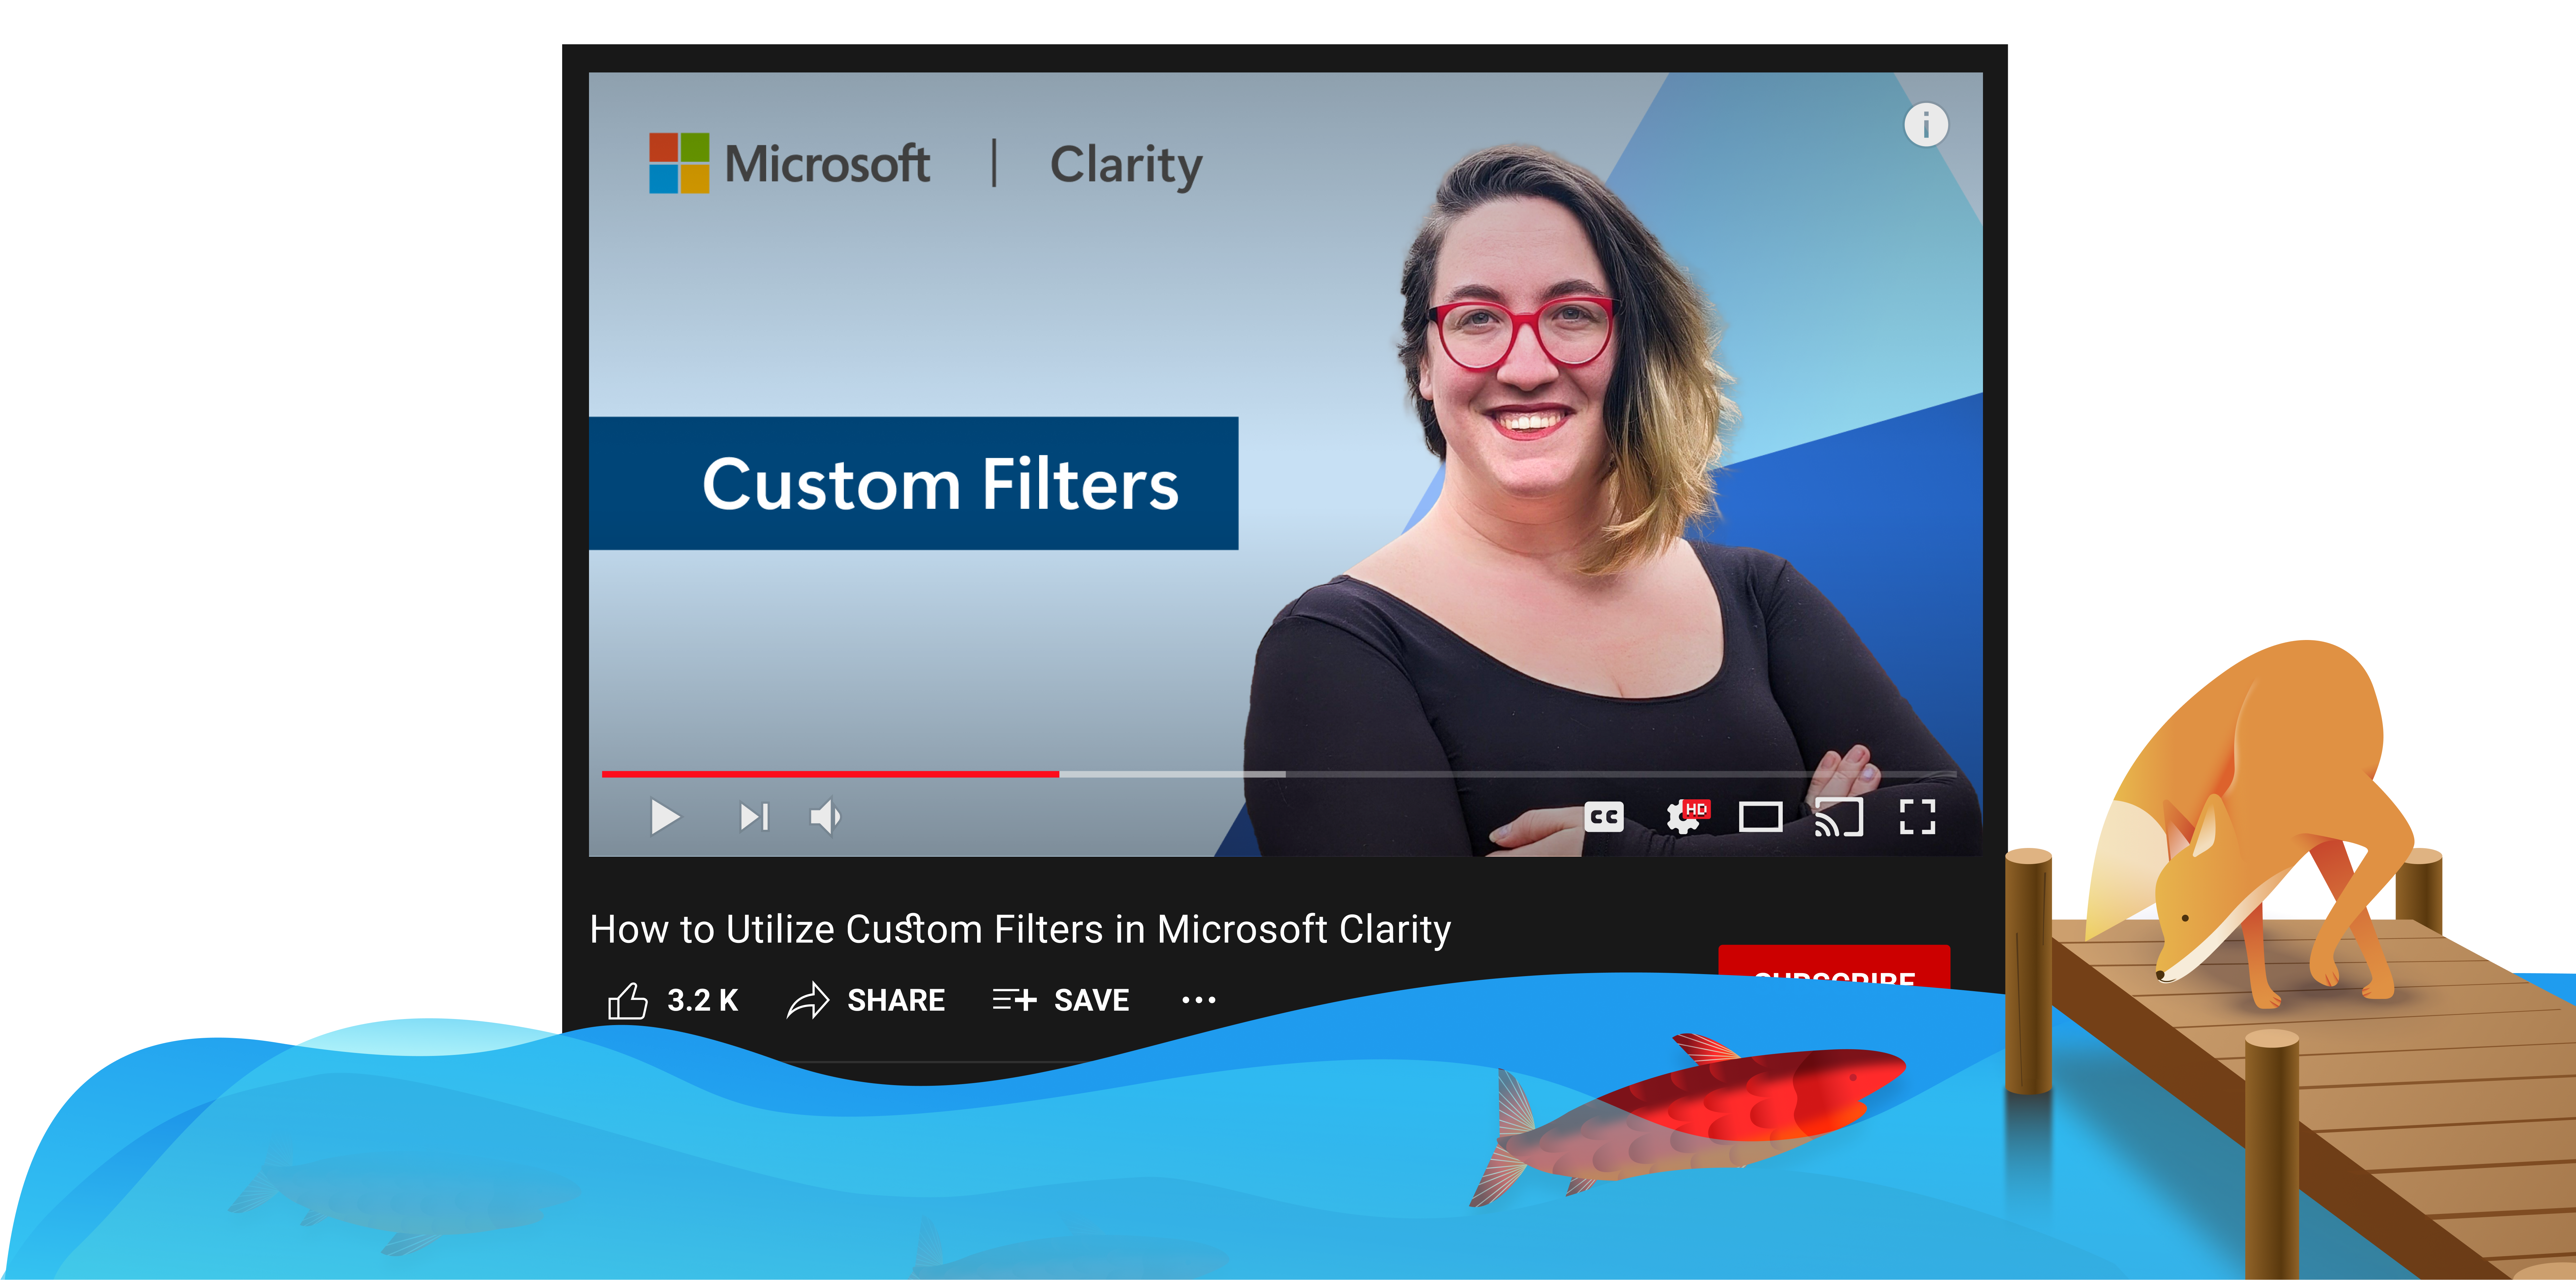
Watch Now: Utilizing Custom Filters in Microsoft Clarity
Unlock deeper insights with custom filters in Microsoft Clarity! Define personalized criteria for tracking user sessions, set custom events, and follow user journeys across devices with unique IDs.
Learn how to set up custom filters and elevate your web analytics—watch our deep dive below!
Don’t forget to subscribe to our YouTube channel and follow us on social so you know when our next video will drop!
Enjoy!
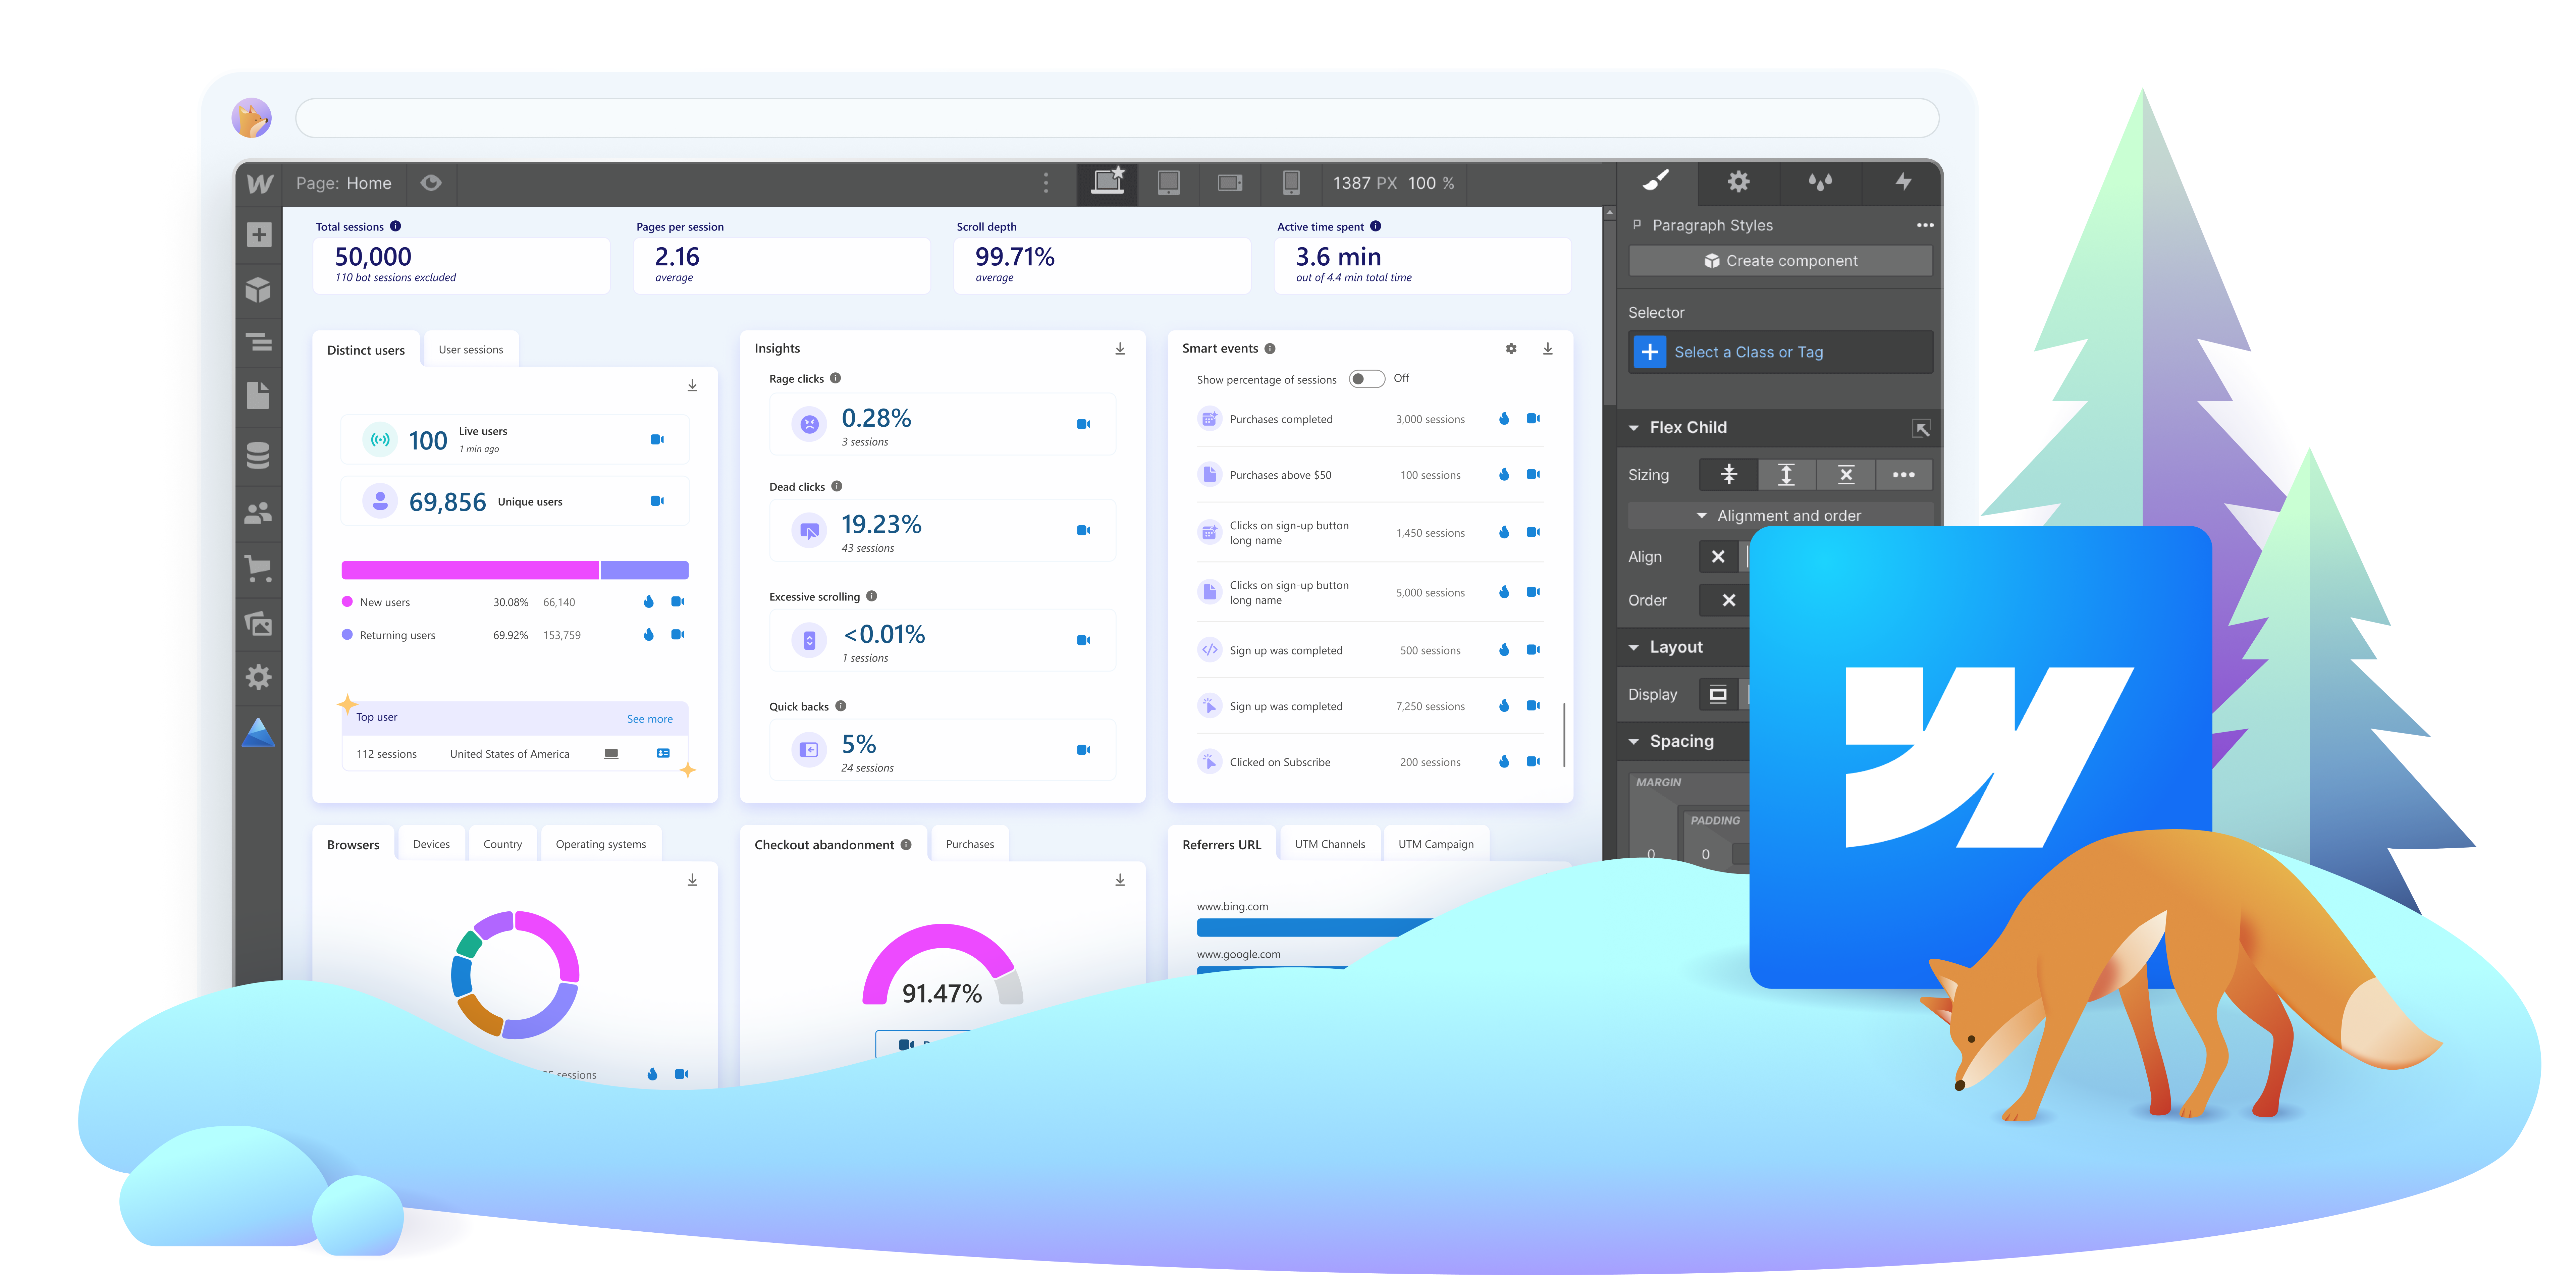
Exciting Updates: Microsoft Clarity’s Enhanced Integration with Webflow
We are thrilled to announce a significant update to the Microsoft Clarity integration with Webflow! Previously, our integration allowed users to embed Clarity’s powerful dashboard directly into Webflow, providing valuable insights into user behavior. Now, we’re taking it a step further by integrating all of Clarity’s features within Webflow. This means you can access everything you need in one place, without the need to shuffle between different products.
What’s New?
With this update, you can now enjoy a seamless experience with the following Clarity features embedded directly into Webflow:
Automatic project creation and linking: From Webflow, easily create new projects or link existing Clarity projects to your Webflow site, ensuring a smooth and efficient setup process
Clarity Dashboard: Access a comprehensive overview of your site’s performance, popular pages, and user insights, such as their location and the devices and browsers they use.
Session Recordings: Examine user behavior as it happened, identifying where things are working smoothly and where users drop off.
Heatmaps: Discover where your users clicked and scrolled, and how they moved around your site. Understand which parts of the page drive the most engagement and which parts get less traffic.
Chat: Interact with Clarity through an intuitive conversational interface to get insights and recommendations using the Copilot experience.
Heatmaps summarization using Copilot: Get summarized insights from heatmaps to quickly understand user behavior patterns.
Session Recordings summarization using Copilot: Receive concise summaries of session recordings to identify key user interactions and issues efficiently.
Why This Matters
Embedding Clarity inside Webflow allows users to have a combined experience for both products within Webflow. This integration ensures that all the powerful features of Clarity are available at your fingertips, making it easier to analyze and optimize user interactions on your website. No more switching between different platforms – everything you need is now in one place, right inside Webflow.
We invite you to explore these new features and see how they can enhance your website’s performance and user experience. With Microsoft Clarity’s enhanced integration with Webflow, you have all the tools you need to make data-driven decisions and improve your site’s design and functionality.
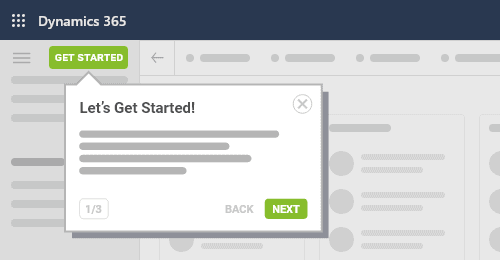
Navigating Dynamics 365 without Microsoft Clarity is like steering through fog without a compass. You’re making guesses about user experience and training without clear direction.
Microsoft Clarity can be a game-changer for boosting Dynamics user adoption, giving you the insights you need to improve workflows, spot navigation issues, and figure out what’s working and what’s not. But there’s one big problem: Dynamics 365 doesn’t natively support Microsoft Clarity. It’s like the treasure chest is there, but the key is missing.
Well, we found the key—and we’re going to show you how to use it.
Why Bother with Microsoft Clarity on Dynamics 365?
Before diving into the “how,” let’s talk about the “why.” Why go through the effort of getting Microsoft Clarity to work with Dynamics 365?
Here’s what Clarity offers:
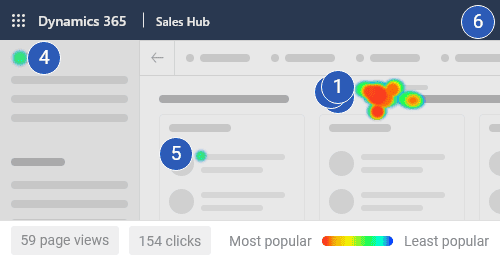
Highlight the Hotspots: See exactly which parts of Dynamics 365 are getting the most action and which are gathering dust. Microsoft Clarity’s heat maps highlight the areas users interact with the most, helping you focus on enhancing popular features and rethinking less-used areas.
Help Users Get Unstuck: Ever wonder why certain tasks seem to take forever or why your team keeps asking the same questions? With Microsoft Clarity, you can review screen recordings to pinpoint exactly where users are getting stuck, allowing you to address these issues before they escalate.
Measure Training Impact: You’ve launched a new training program, but is it making a difference? Use Microsoft Clarity to compare user behavior before and after the training, so you can see if users are navigating more effectively and using new features as intended.
Catch Errors Before They Snowball: From JavaScript errors to user mistakes, small issues can quickly escalate. Microsoft Clarity helps you spot these early by providing detailed session recordings and error tracking, allowing you to fix problems promptly and ensure a smoother user experience.
If you’d like more ideas on how to use Microsoft Clarity to boost digital adoption, this guide, What Is Microsoft Clarity, is helpful.
At the end of the day, it’s all about making Dynamics 365 easier and more intuitive for your team. Microsoft Clarity gives you the insights to simplify navigation and tweak layouts, making the whole experience smoother.
How to Get Microsoft Clarity to Work on Dynamics 365
To get Microsoft Clarity tracking on a page, you’d usually just drop a little snippet of code into your site’s HTML, and voilà! You’re good to go. But Dynamics 365 doesn’t give you access to that. No HTML access means no Clarity… unless you know a little trick.
Ask Vic by VisualSP is a versatile browser extension that works with all web applications, including Dynamics 365. Its seamless integration with Dynamics 365 makes it straightforward to connect with Microsoft Clarity, allowing you to gain valuable insights directly within your Dynamics environment.
Here’s how to make it happen:
Step 1: Sign Up for VisualSP (It’s Free)
First, head over to VisualSP and create a free account. In about 48 hours, VisualSP will set up a Clarity project just for you. They’ll customize security settings to our recommendations for Dynamics and connect it directly to your VisualSP account. Easy peasy.
Step 2: Install the Ask Vic Extension
Next, have your team download and install the Ask Vic extension (you’ll get clear steps on how to do this when you sign up). This is where the fun begins. Once it’s installed, it’ll start capturing user behavior data within Dynamics 365 right away. Plus, you get access to all the other cool stuff Ask Vic offers, like in-app help and walkthroughs.
Step 3: Dive Into Your Clarity Dashboard
With the extension up and running, all that data starts flowing into your Microsoft Clarity dashboard. Heat maps, session recordings, user journeys—you name it, it’s all there. You’ll finally have the insights you need to make smart, data-driven decisions for your team.
Ready to Level Up Your Team’s Dynamics 365 Experience?
Integrating Microsoft Clarity with Dynamics 365 via Ask Vic helps you understand user behavior, streamline training, and identify areas for improvement. This means a more intuitive system, faster team onboarding, and a smoother user experience.
To get started, take advantage of VisualSP’s free basic package, which includes essential tools and features to help you get the most out of Microsoft Clarity and Dynamics 365.
Filters in Microsoft Clarity help you analyze specific user subsets by narrowing down data based on user behavior, session attributes, traffic sources, device types, and more. With over 40 filters available, you can easily focus on relevant sessions, gain deeper insights, and save filters as segments for quick re-application across recordings and heatmaps.
Learn how to optimize your data analysis and improve user experience with Clarity’s powerful filtering features by watching the video below!
Don’t forget to subscribe to our YouTube channel and follow us on social so you know when our next video will drop!
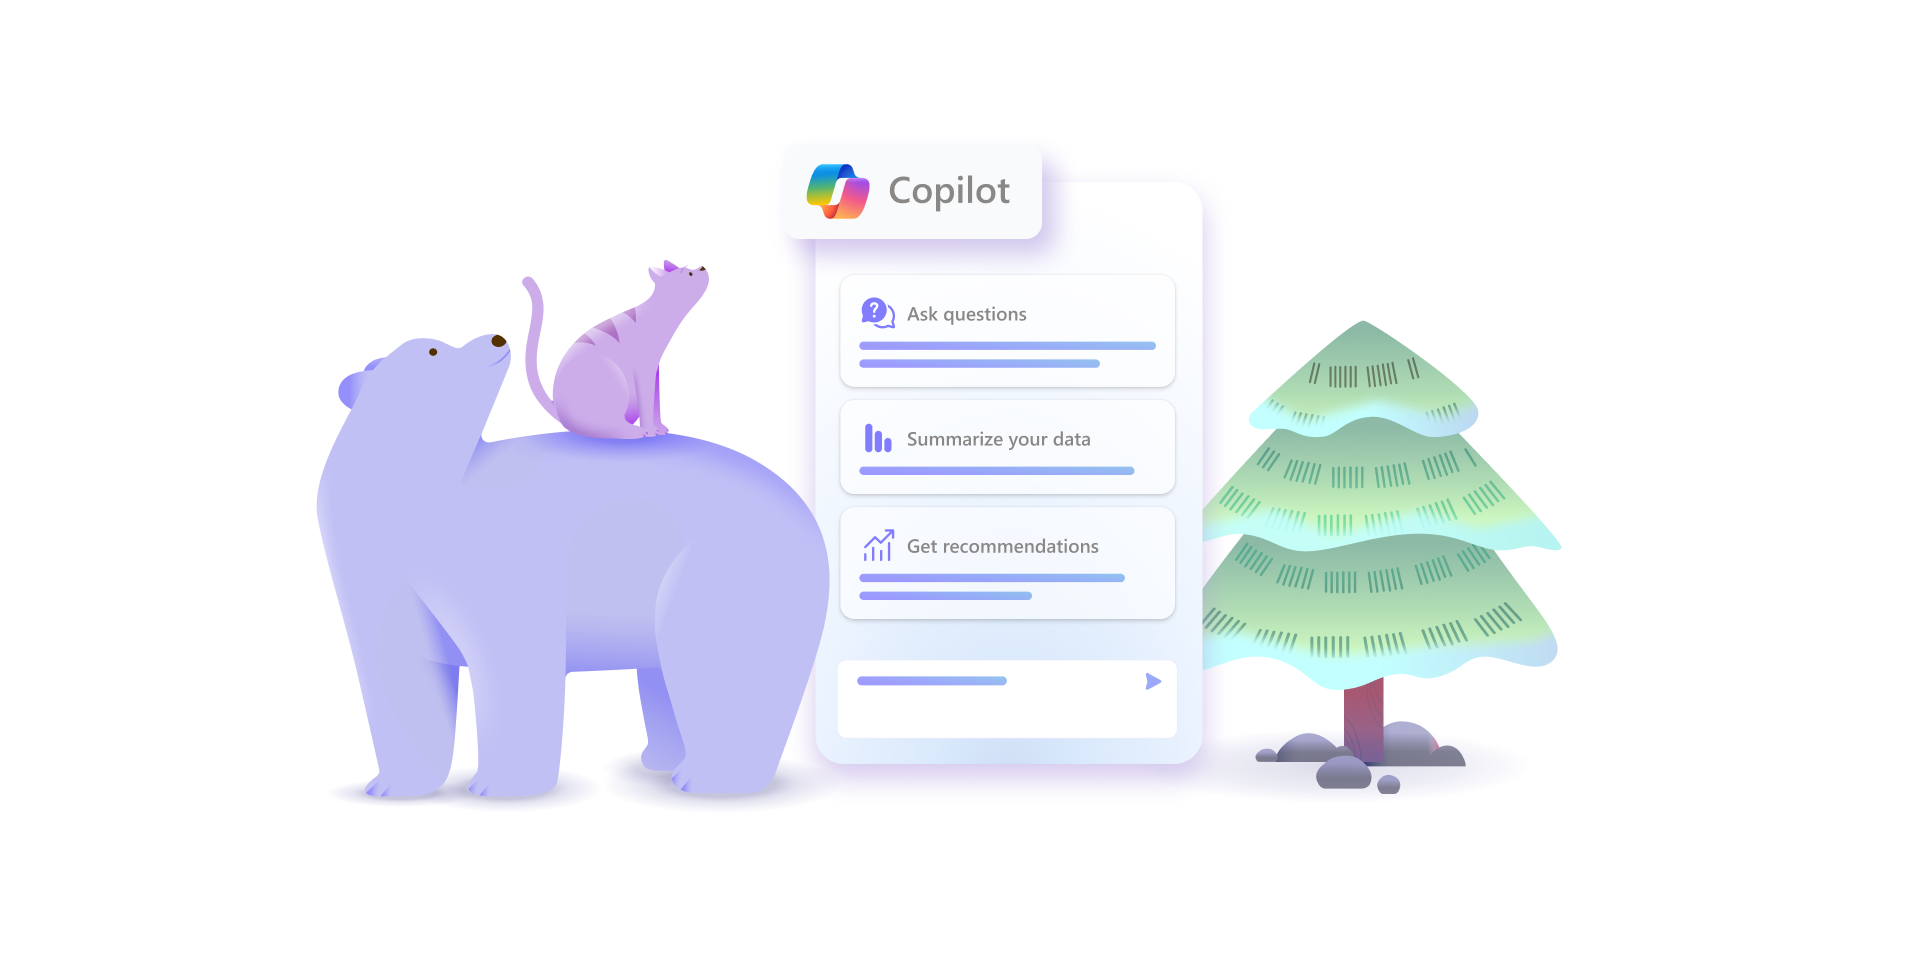
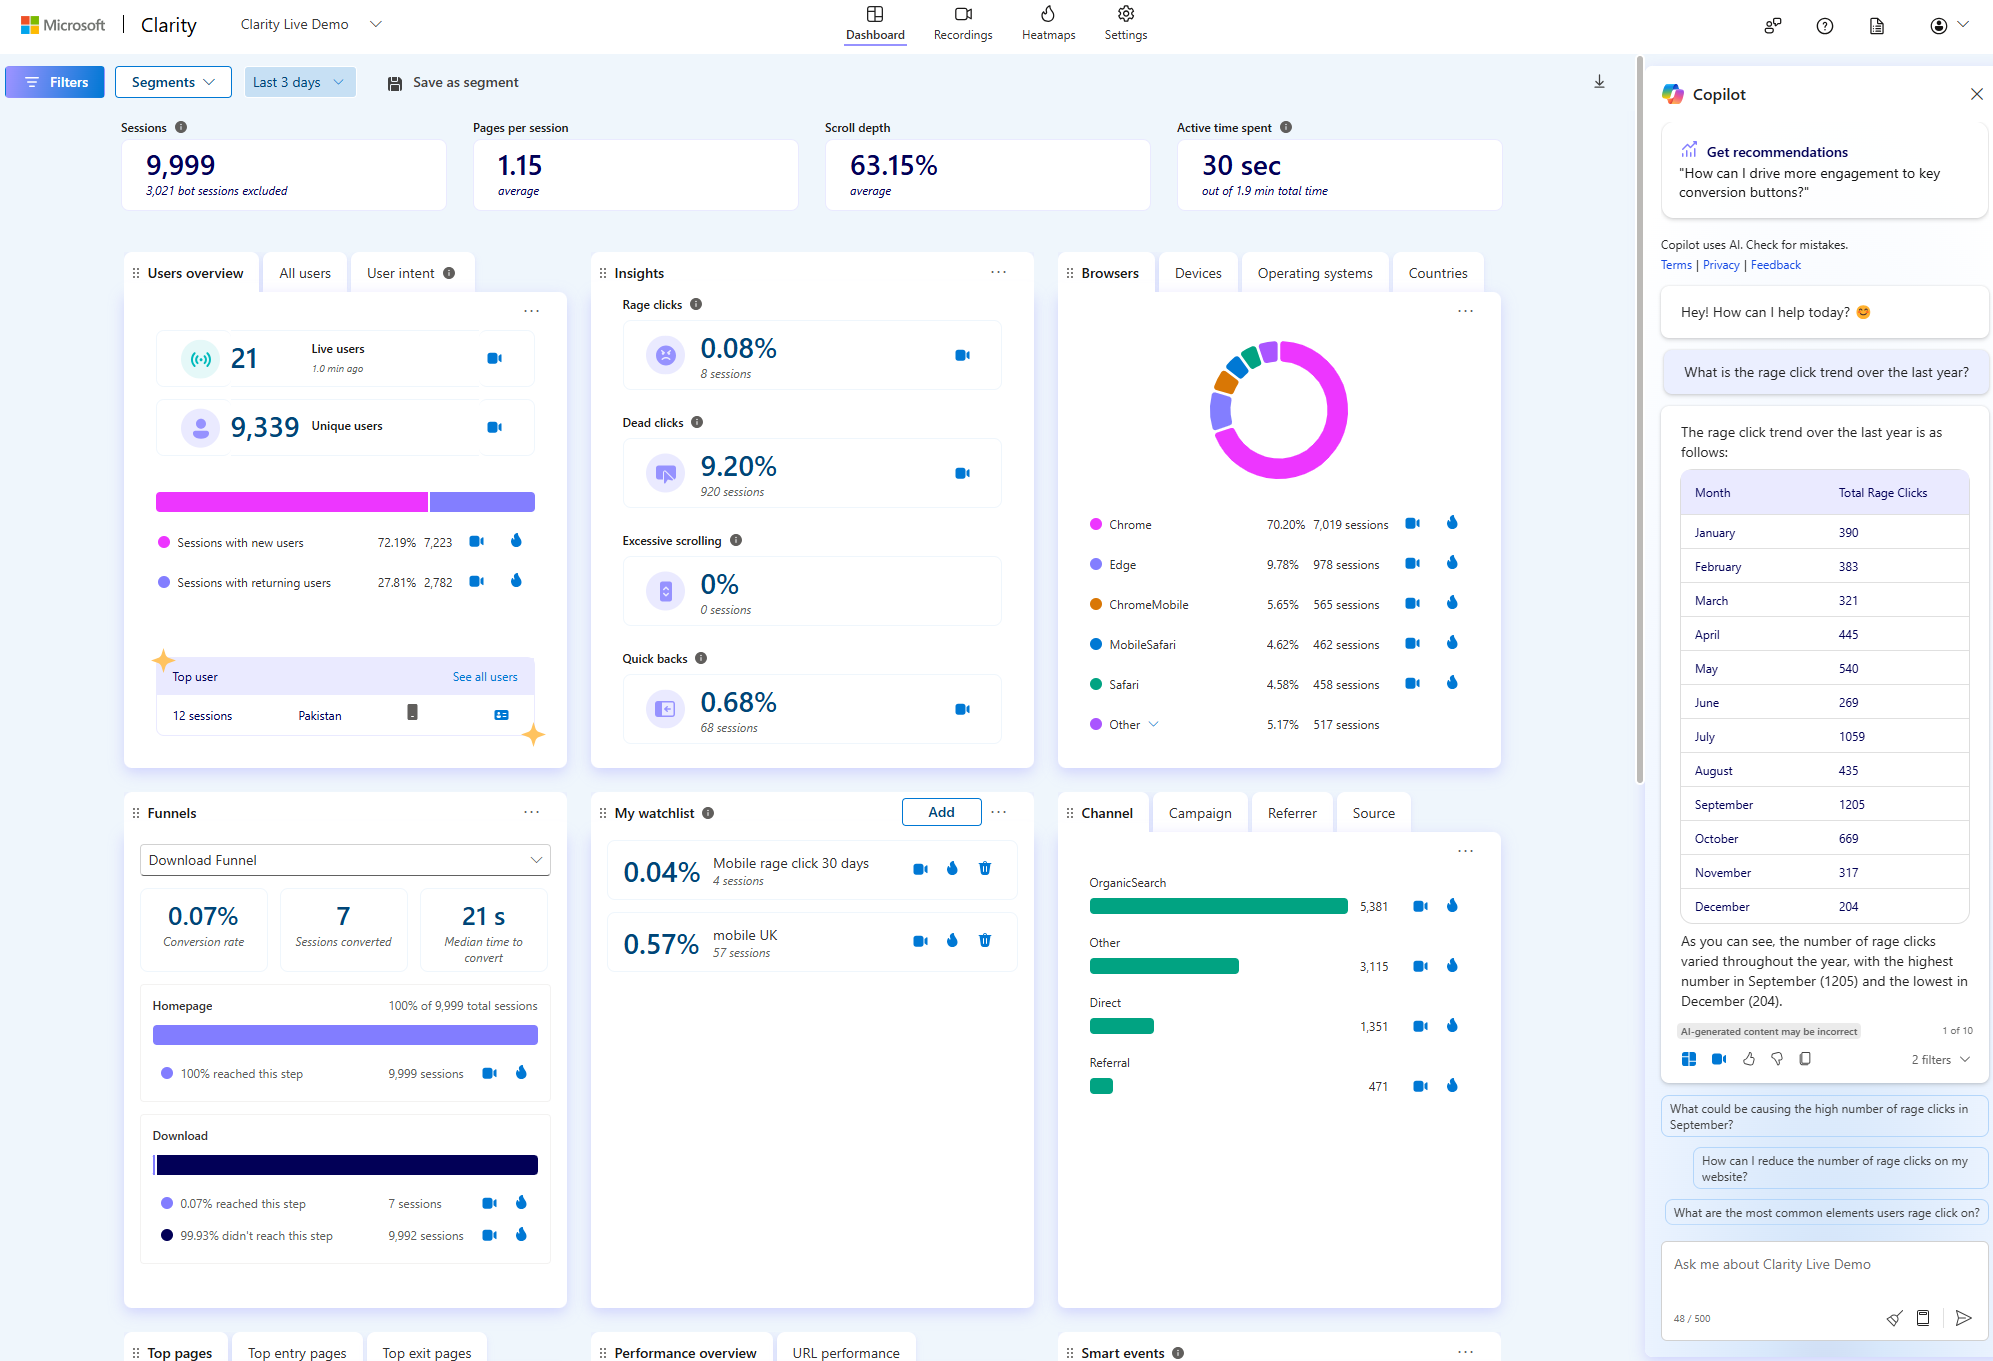
We’re excited to announce the launch of our latest Copilot feature in Microsoft Clarity: Chat! You can now get instant answers to your dashboard-related questions and custom help on optimizing your website.
What is Chat?
Chat is a Copilot experience in the Clarity dashboard. We leverage the same technology built into ChatGPT and apply it to your website data. Simply type in your question and Copilot will generate a response based on its understanding of your Clarity project’s dashboard analytics.
What can Chat do?
View your analytics easily. Copilot generates answers to your metric questions and surfaces the right filters. Sample questions include:
How many distinct users visited my site yesterday?
What were the total number of sessions last week from Poland?
What was the percentage of rage clicks for sessions on mobile devices?
Summarize your data: Chat can display new views of your data and identify key trends. Make sure to phrase the question in a way it can understand, like:
Show me a breakdown of my scroll depth by referrer
What are the top JavaScript errors on my homepage?
Which UTM campaigns are driving the most traffic?
Get recommendations: Copilot brainstorms and provides tips based on its built-in understanding of the web. Keep in mind, it can’t watch your session recordings (yet) so it will only tailor responses to your dashboard metrics:
How can I improve rage clicks on my site?
How do I optimize call-to-action buttons on a website?
What are some ways to optimize ad campaigns?
My website traffic is declining – how can I investigate it?
How can I use Chat?
Simply log into your Clarity account and navigate to a Clarity project. Select the Copilot icon at the top right of your dashboard. A chat window will open where you can type in your question.
If you’d like to browse through some ideas of what to ask, select the Prompt Guide icon. See more details on our documentation here.
Conclusion
Chatting with Copilot is a big step in our mission to make analytics accessible for everyone. We’d love to hear your thoughts – send us feedback via email or directly in the product (Smiley icon on top right). We listen closely to your comments and can’t wait to keep innovating together!
PS: Interested in our other Copilot features? Visit our Copilot guide describing Session Insights, Grouped Session Insights, and Heatmap Insights.
Unlock the Future of User Interaction with Microsoft Clarity’s Predictive Heatmaps
In this blog post, we’ll dive into the details of this cutting-edge tool, explain how it works, its key benefits, and practical use cases to help you make the most of your website’s potential.
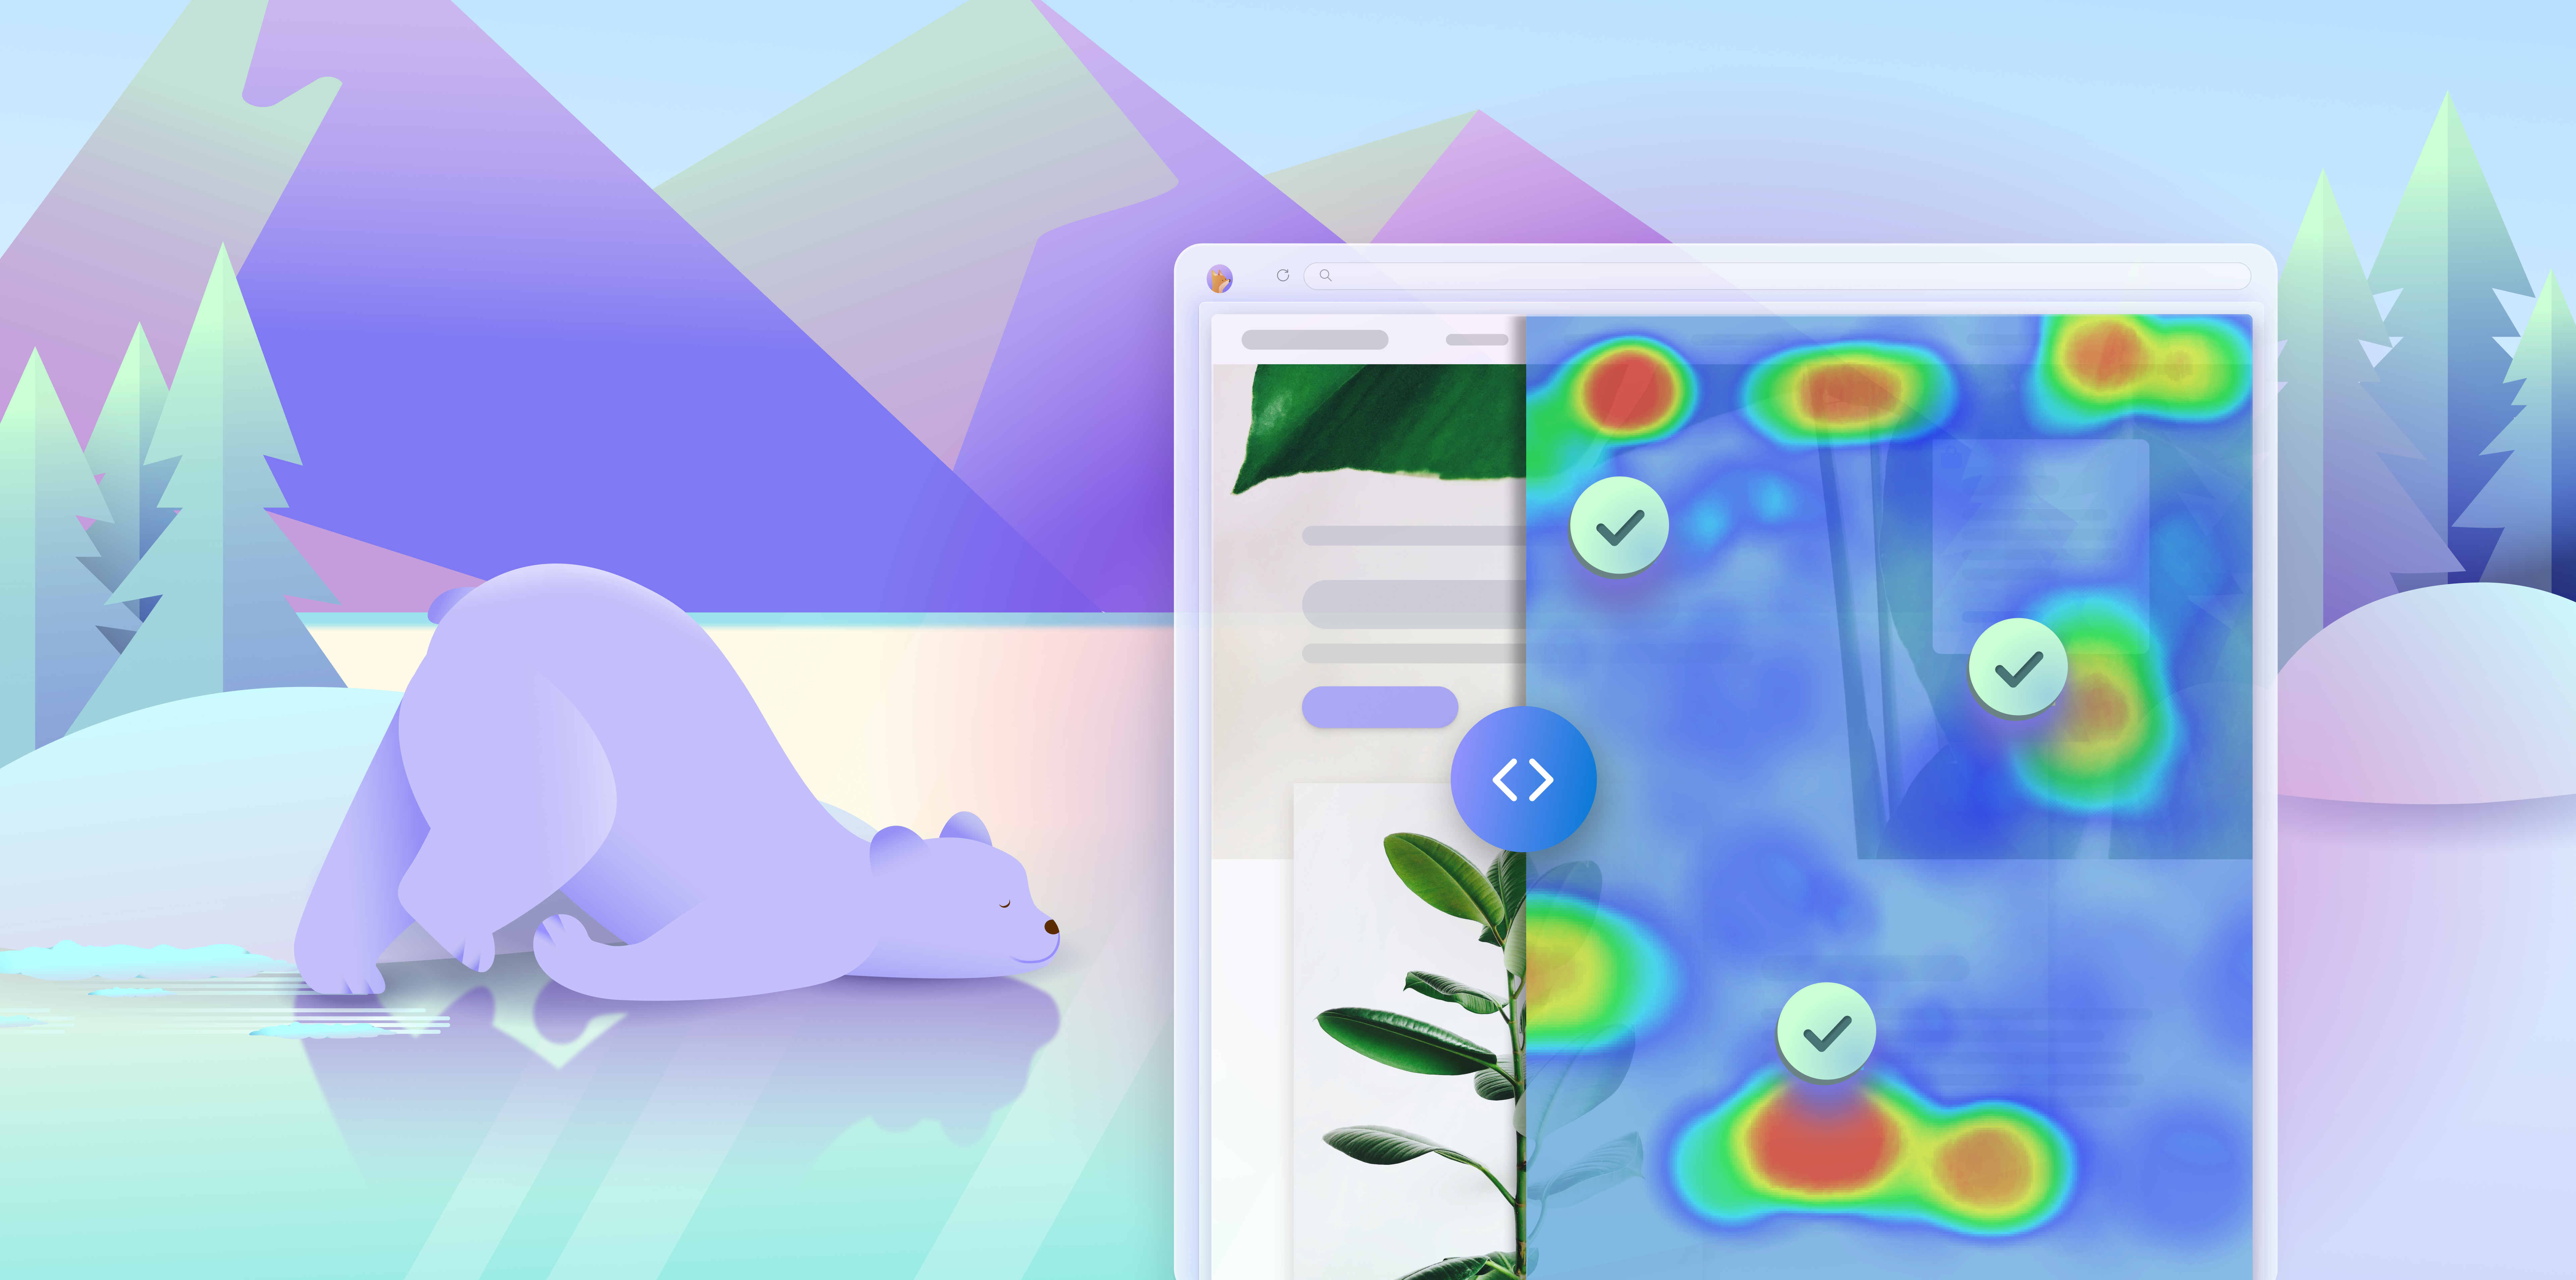
What Are Predictive Heatmaps?
Predictive Heatmaps are a revolutionary feature that leverage advanced AI & machine learning models to forecast user interactions on your website. Unlike traditional heatmaps which provide data based on past user behavior, Predictive Heatmaps give you a glimpse into the future, showing you where users are likely to click, scroll, and spend most of their time. This foresight allows you to make proactive, data-driven decisions to enhance user experience and optimize your site’s performance.
How Do Predictive Heatmaps Work?
Predictive Heatmaps analyze patterns from historical data and apply AI models to predict future interactions. By understanding these patterns, Clarity can generate visual representations of potential user behavior on your website, helping you identify hotspots and cold spots even before real users interact with your site.
Key Benefits of Predictive Heatmaps
Future insights: Anticipate where users are likely to click, scroll, or spend the most time on your pages. This helps in planning and optimizing content placement effectively.
Improved user experience: Identify potential areas of interest or concern before they become significant issues, ensuring a smoother and more engaging user journey.
Conversion rate optimization: Make proactive adjustments to your site based on predicted engagement on your call-to-action buttons to increase conversions.
Proactive design improvements: Anticipate user experience and design problems ahead of launch, allowing you to address them before they impact your users.
Example Use Case: Imagine you’re planning a major redesign of your homepage. With Clarity’s predictive heatmaps, you can see which areas of the new design are likely to attract the most attention and clicks. This foresight allows you to optimize the layout and content placement before the redesign goes live, ensuring that the most important elements are seen and interacted with by your users.
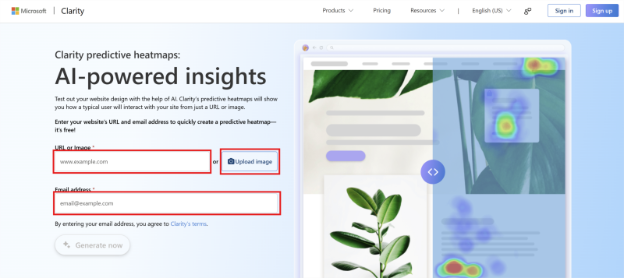
How to Get Started with Clarity’s Predictive Heatmaps
Go to Clarity’s Predictive Heatmaps: Navigate to the Resources menu and select Predictive heatmaps
Select an image or enter a URL: Choose an image or enter a URL that you want to analyze. Clarity will generate a predictive heatmap based on historical data and machine learning models.
Analyze and Optimize: Review the predictive heatmap to identify key areas of user interaction. Use these insights to make informed decisions about content placement, design changes, and user flow improvements.
Clarity’s predictive heatmaps are set to transform how we understand and anticipate user behavior on websites. By providing a glimpse into future interactions, this feature enables web developers, designers, and marketers to make smarter, data-driven decisions. Don’t wait for user behavior to dictate your next move—predict it with Microsoft Clarity’s Predictive Heatmaps.
Ready to unlock the future of user interaction? Click here to start using Clarity’s Predictive Heatmaps to enhance your website’s performance and user experience.
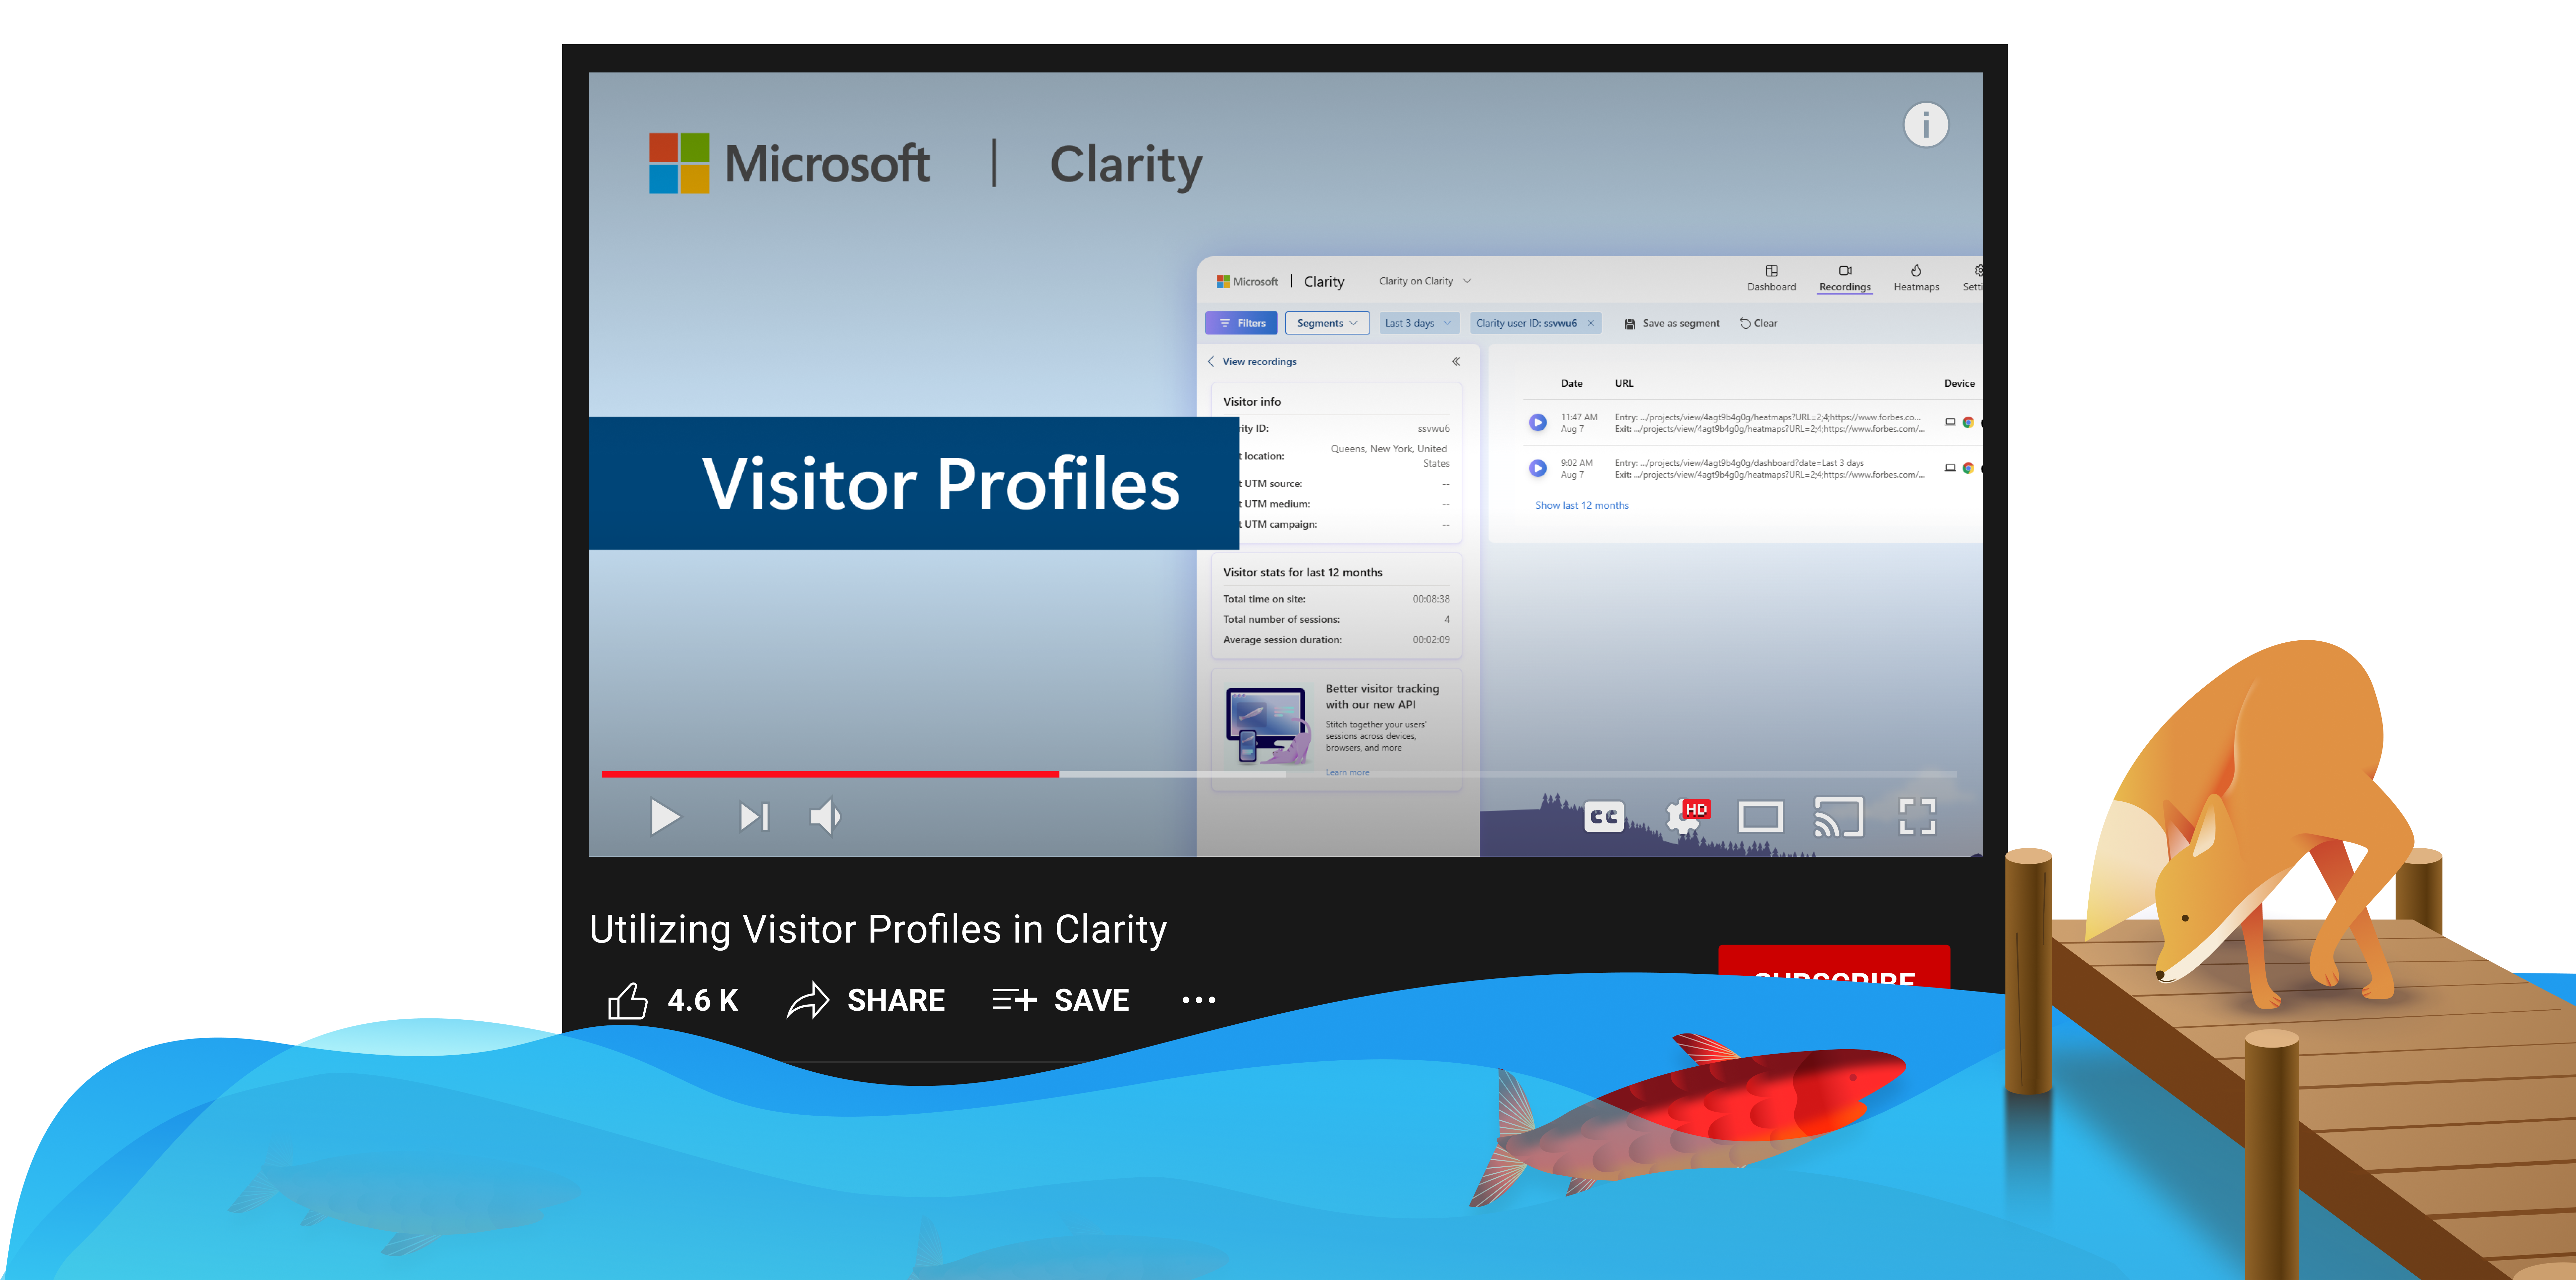
Watch Now: Utilizing Visitor Profiles in Microsoft Clarity
See how tracking user interactions across sessions can reveal key insights, identify pain points, and optimize the user journey. Discover the power of Visitor Profiles in Microsoft Clarity!
Watch the video for a deeper look:
Don’t forget to subscribe to our YouTube channel and follow us on social so you know when our next video will drop!