A Comparative Guide of Top Behavioral Analytics Platforms

A Comparative Guide of Top Behavioral Analytics Platforms

Data and behavioral analytics are essential for any website owner who wants to understand how they can improve their user experience, conversion rates and how their visitors interact with their site. There are many tools on the market that offer data and behavioral analytics, such as session recordings, heatmaps, surveys, feedback, and more. However, not all tools are created equal, and some may suit your needs better than others.  

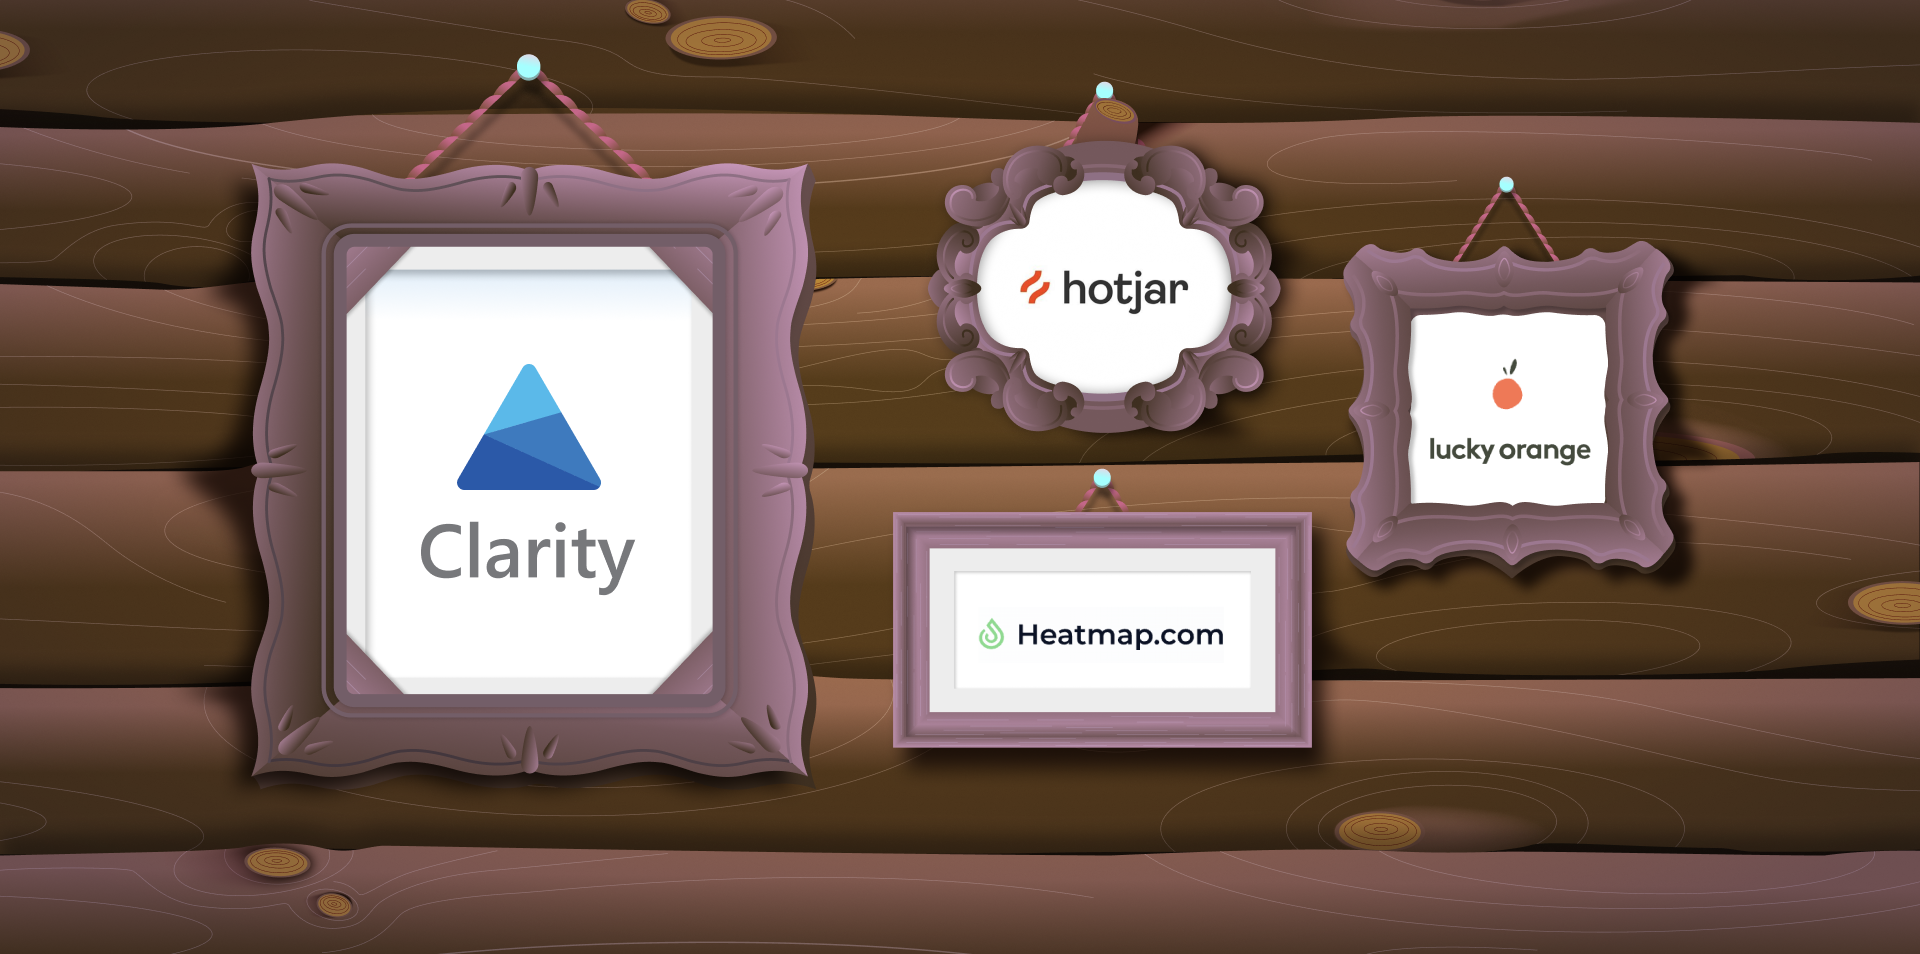
In this blog post, we will compare Microsoft Clarity, a free and powerful data and behavioral analytics tool, with three other players in the space: Hotjar, Lucky Orange, and Heatmap.com. We will look at the pros and cons of each tool, their pricing, and their features. By the end of this post, you will have a better idea of how Microsoft Clarity stacks up against the others and why it should be your go to tool for data and behavioral analytics. 

Microsoft Clarity

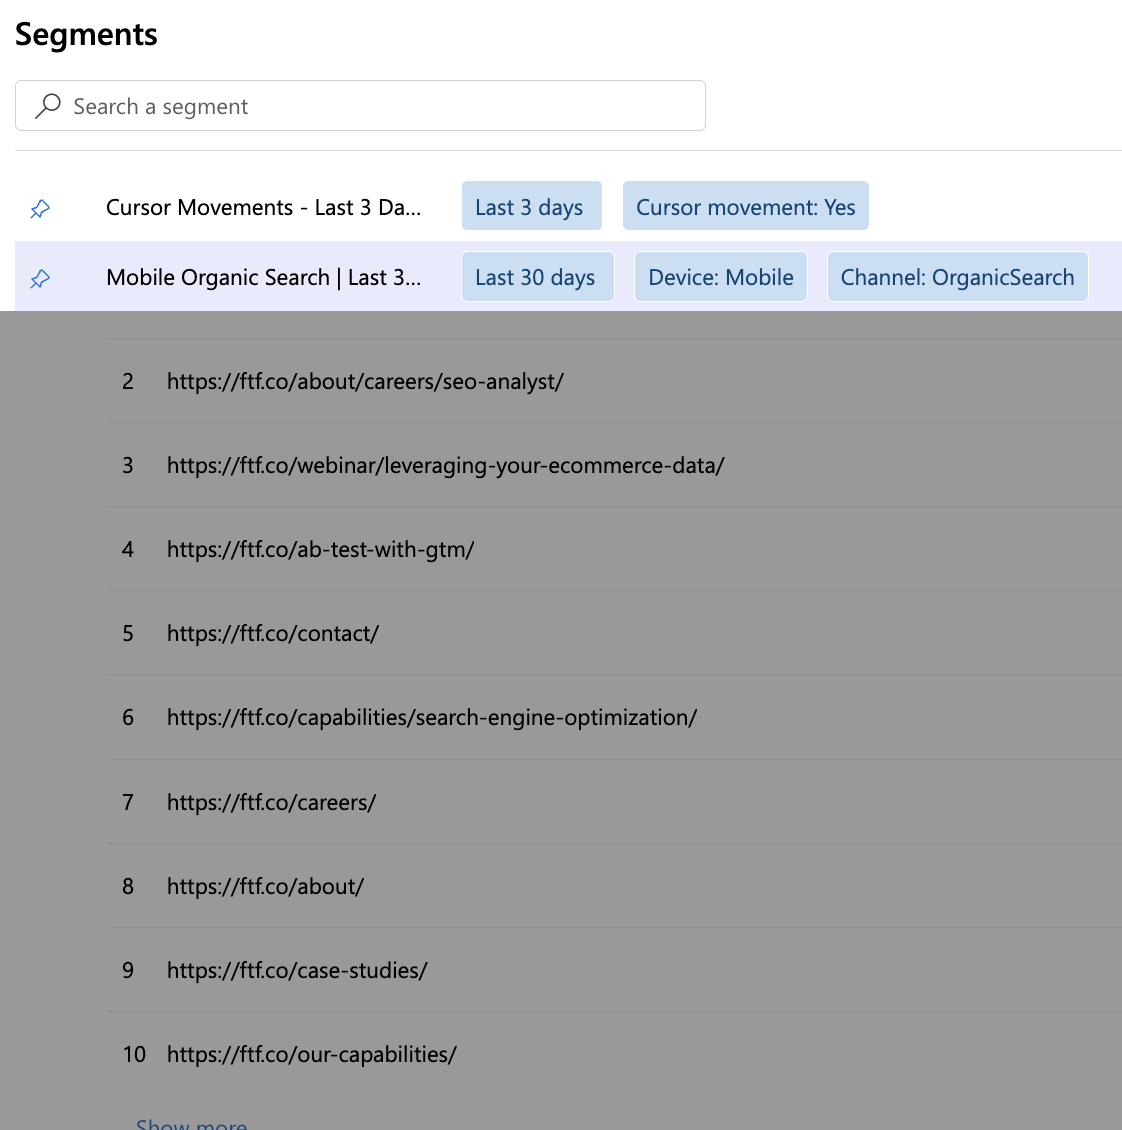
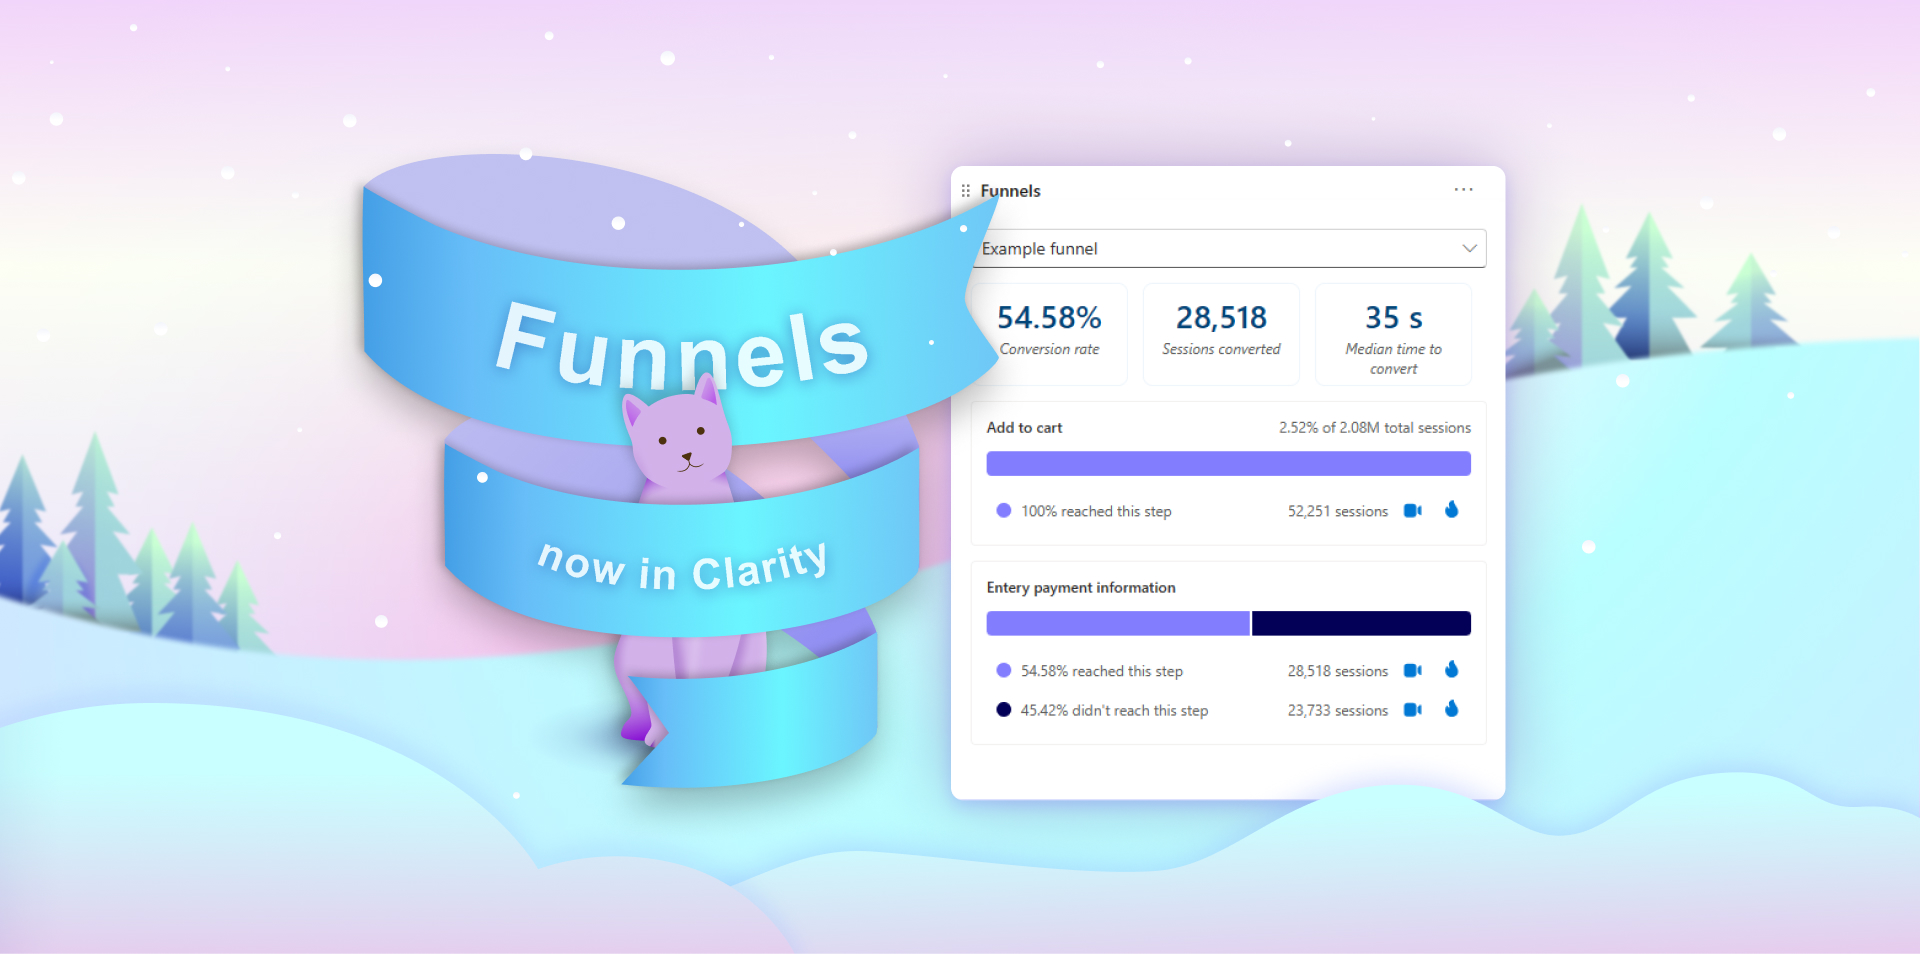
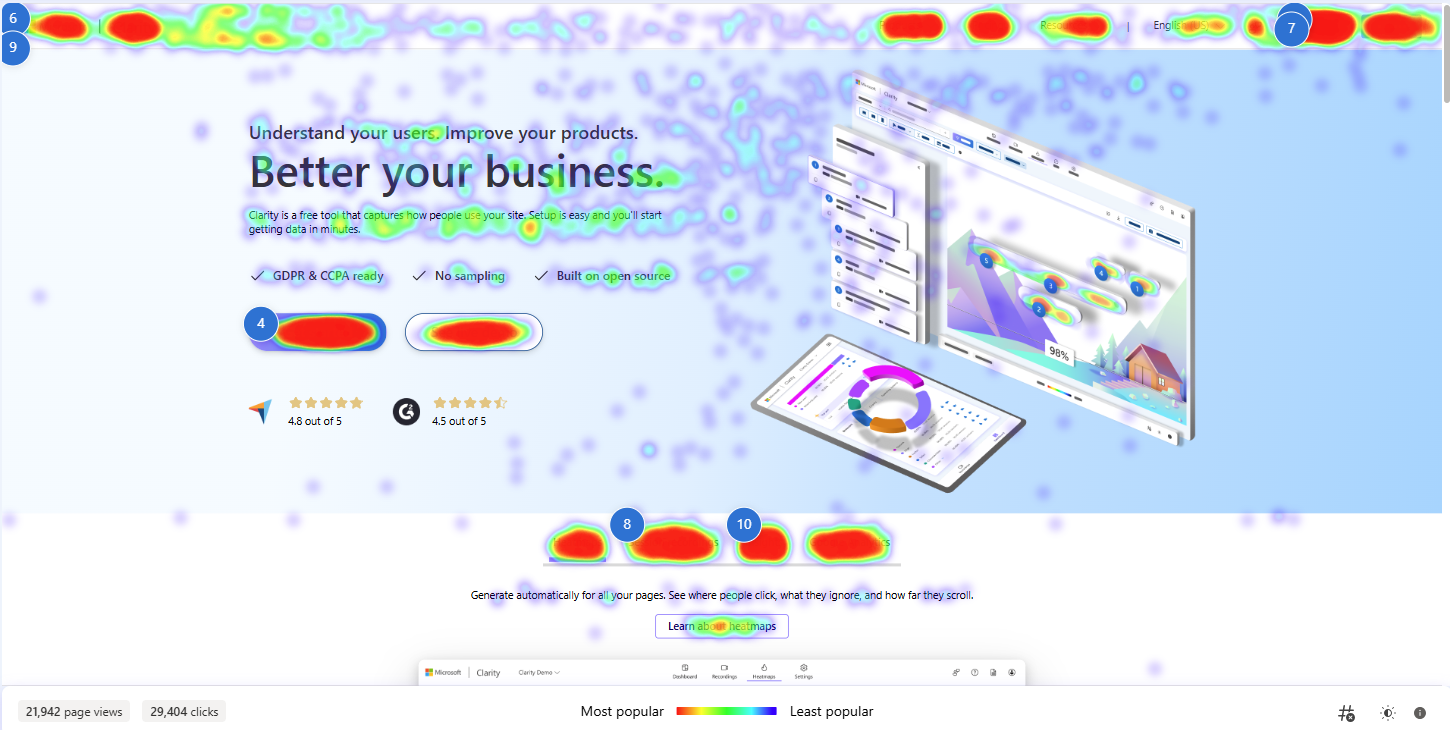
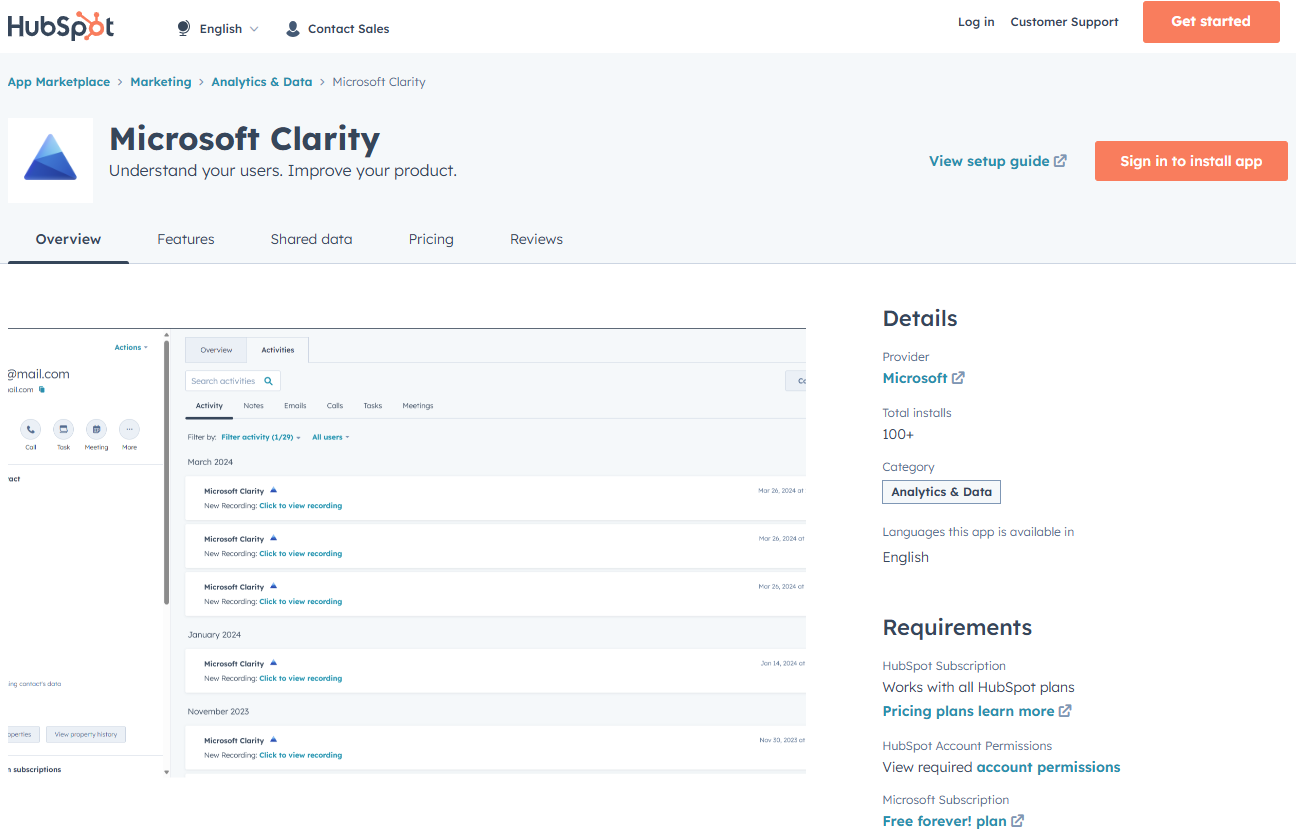
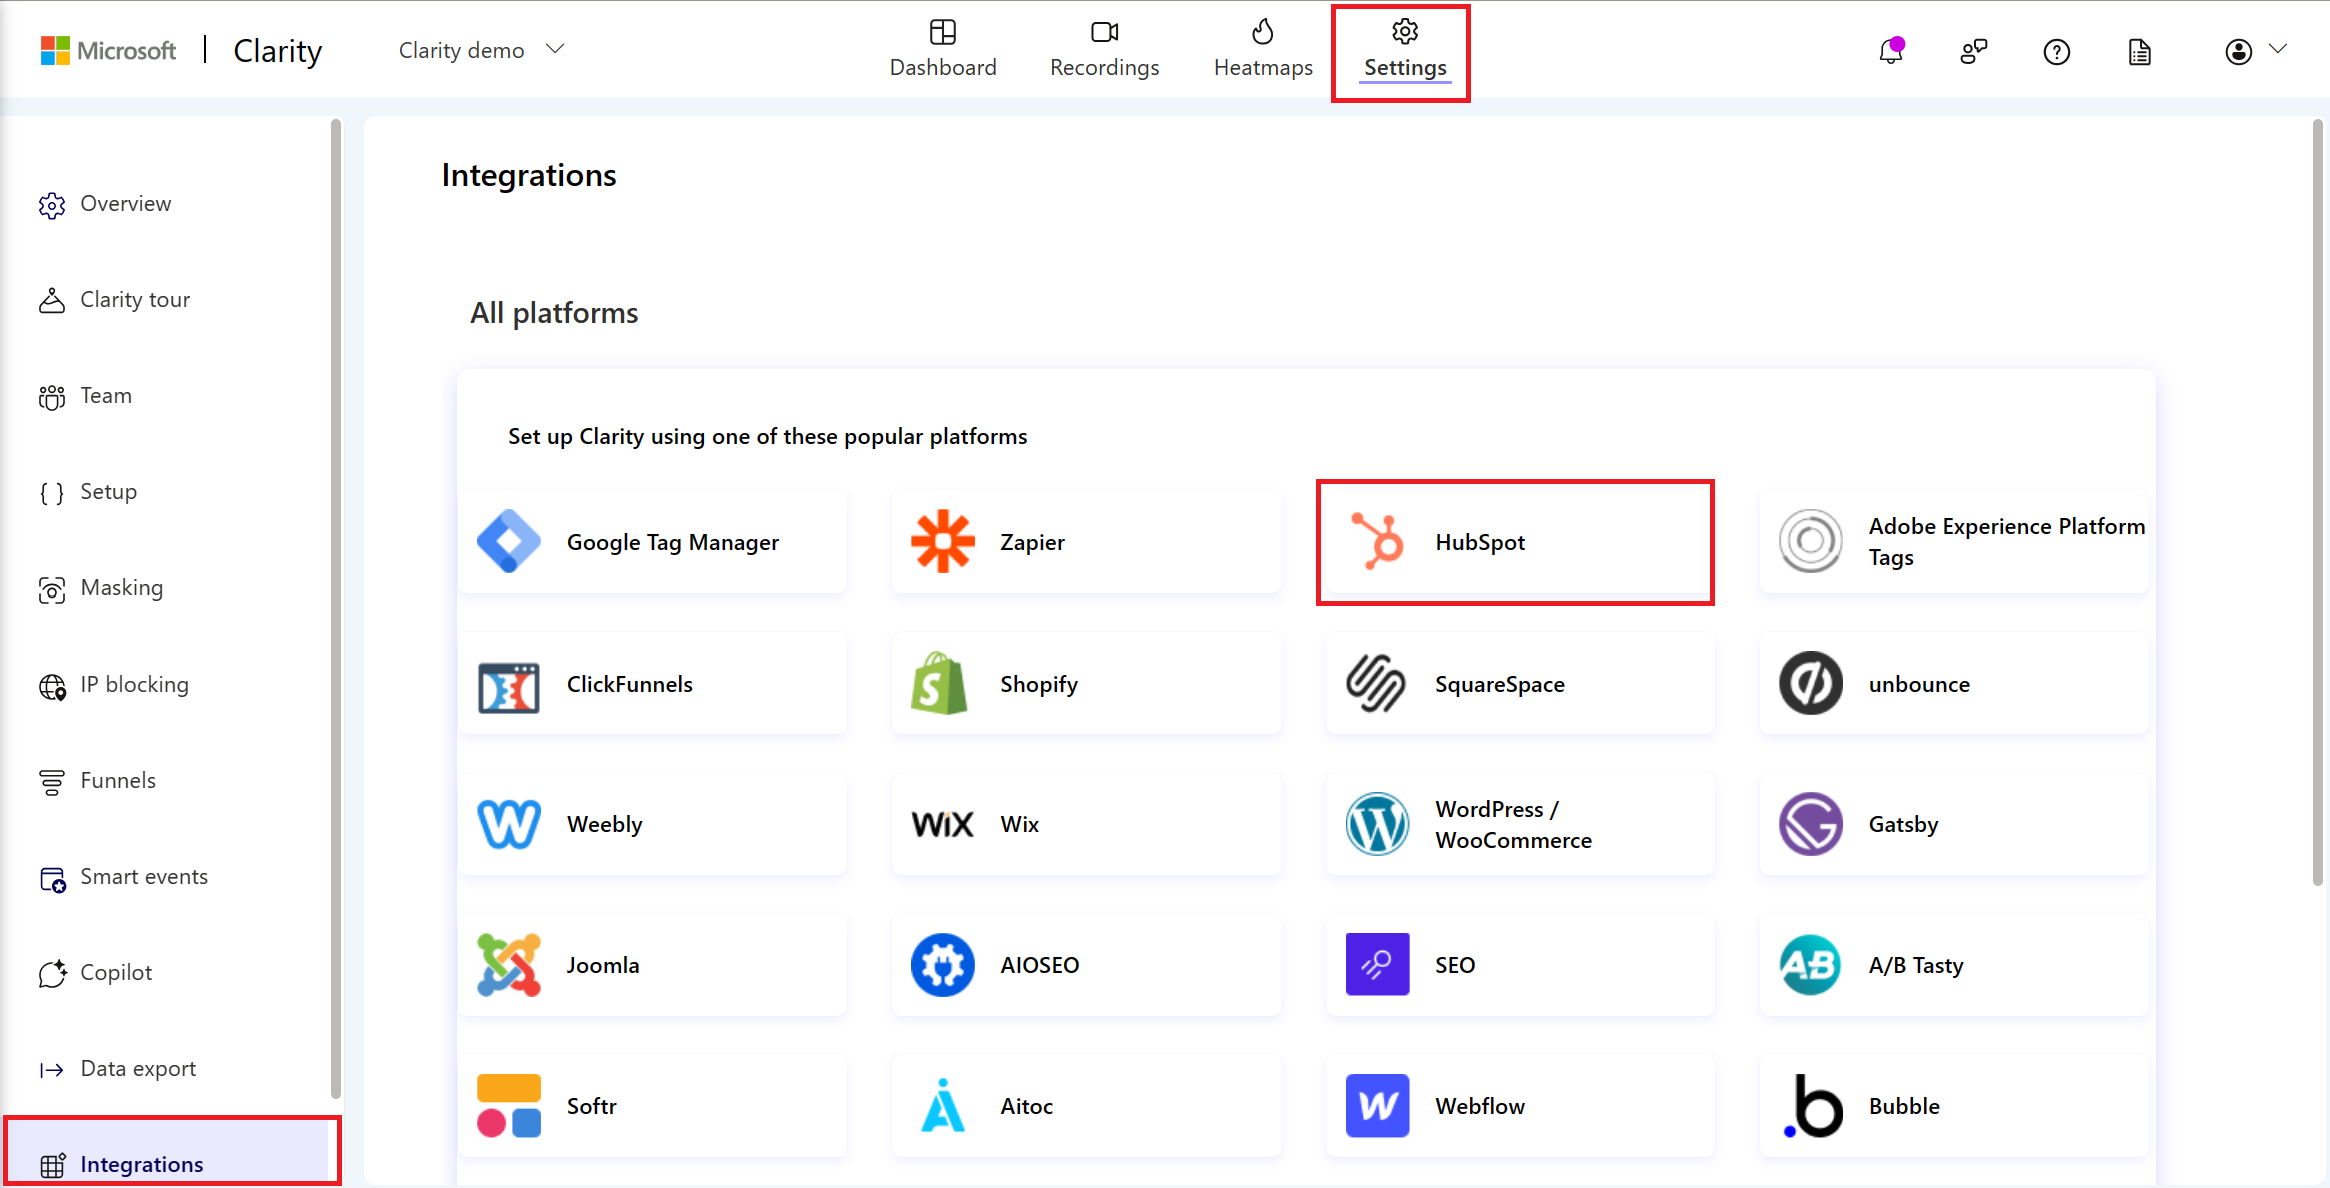
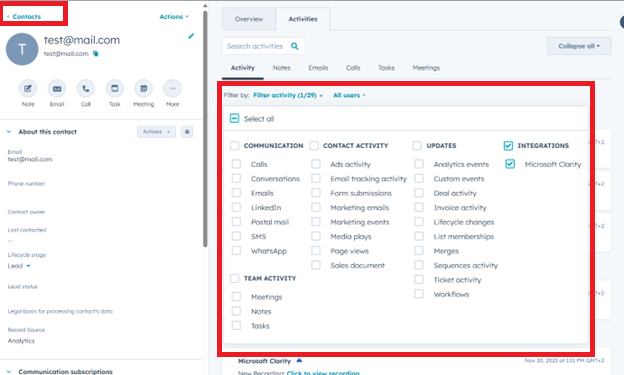
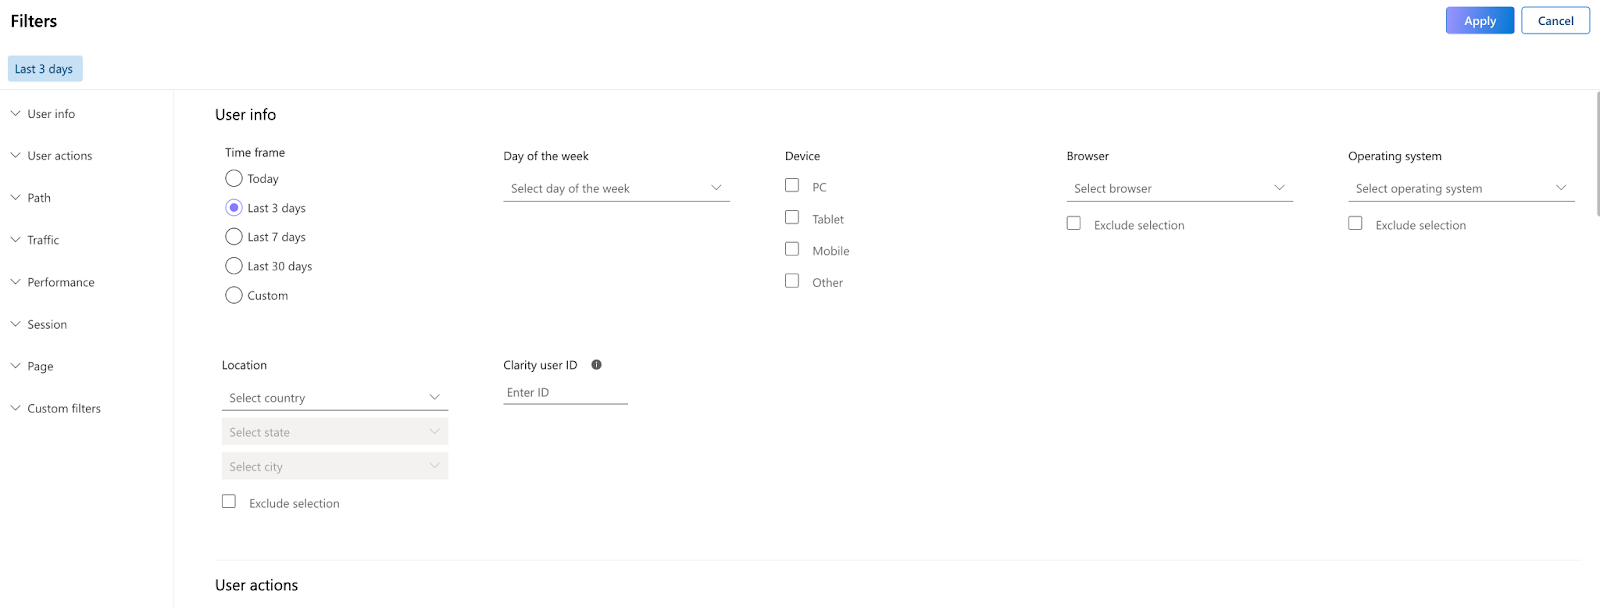
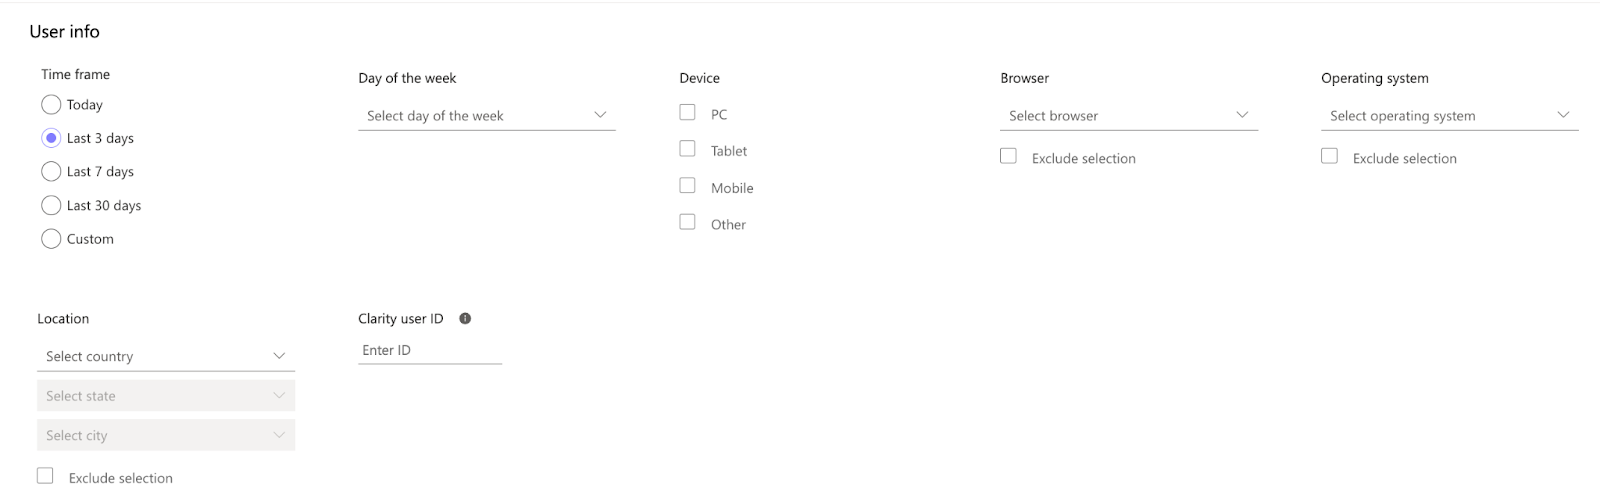
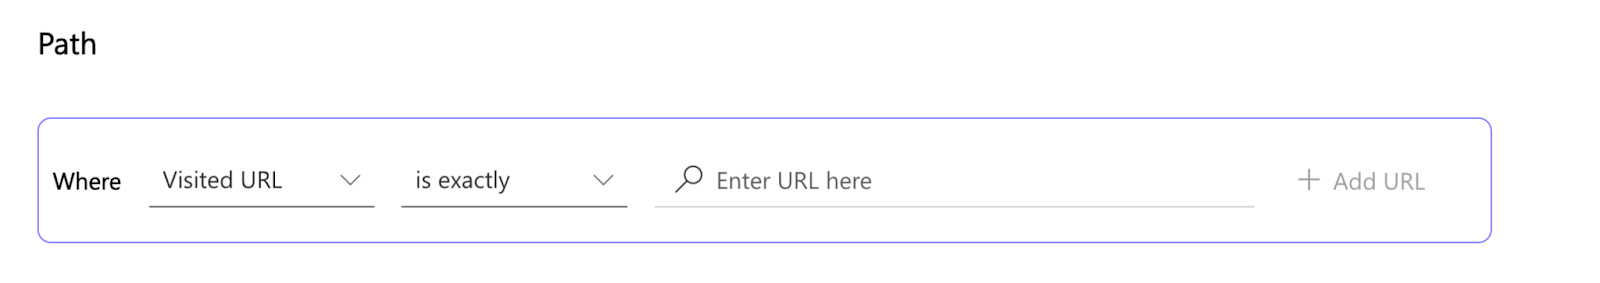
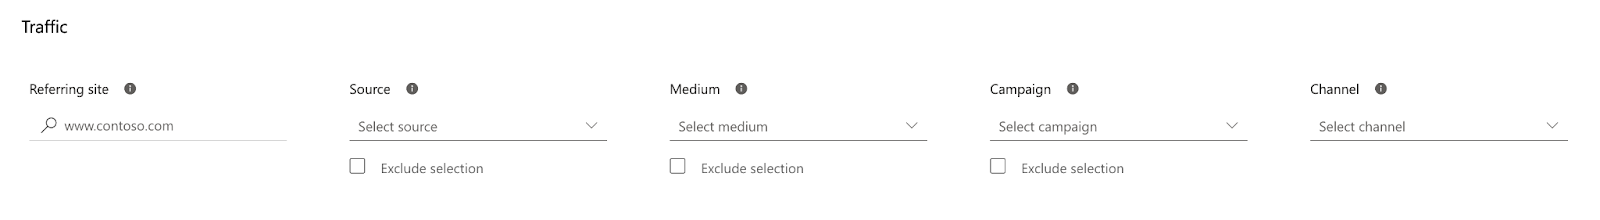
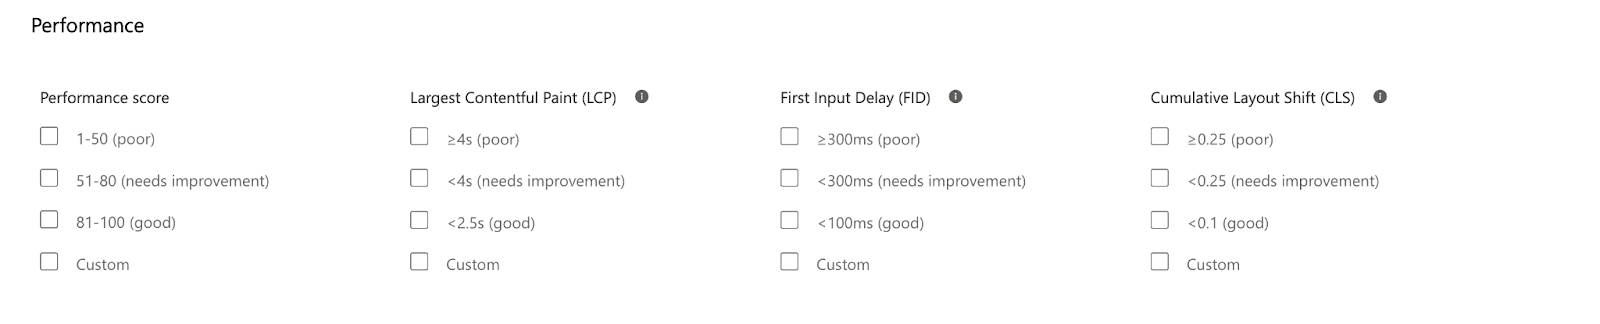
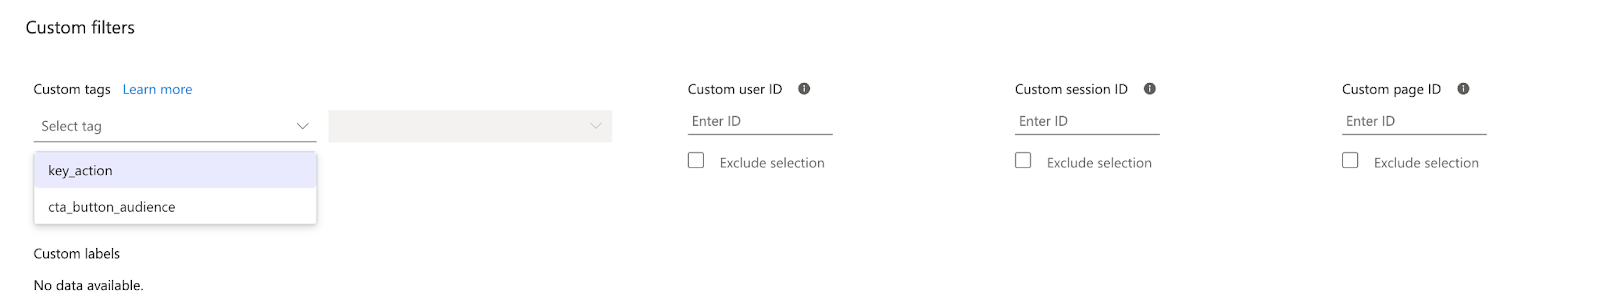
Microsoft Clarity stands out as a free analytics tool that provides a wealth of features to help you understand user behavior on your website. It offers heatmaps, session recordings, and insights into user interactions, making it easier to pinpoint the ‘why’ behind user actions. Notably, Clarity excels in detecting JavaScript errors, which is crucial for enhancing site performance. Microsoft Clarity also has some unique features and advantages that make it a strong alternative to the competitors in the space, such as the ability to filter and segment your data, Rage Clicks and other insight metrics, data privacy and security, the accuracy and reliability of your data, a suite of Copilot features and the compatibility with dynamic and responsive websites. 

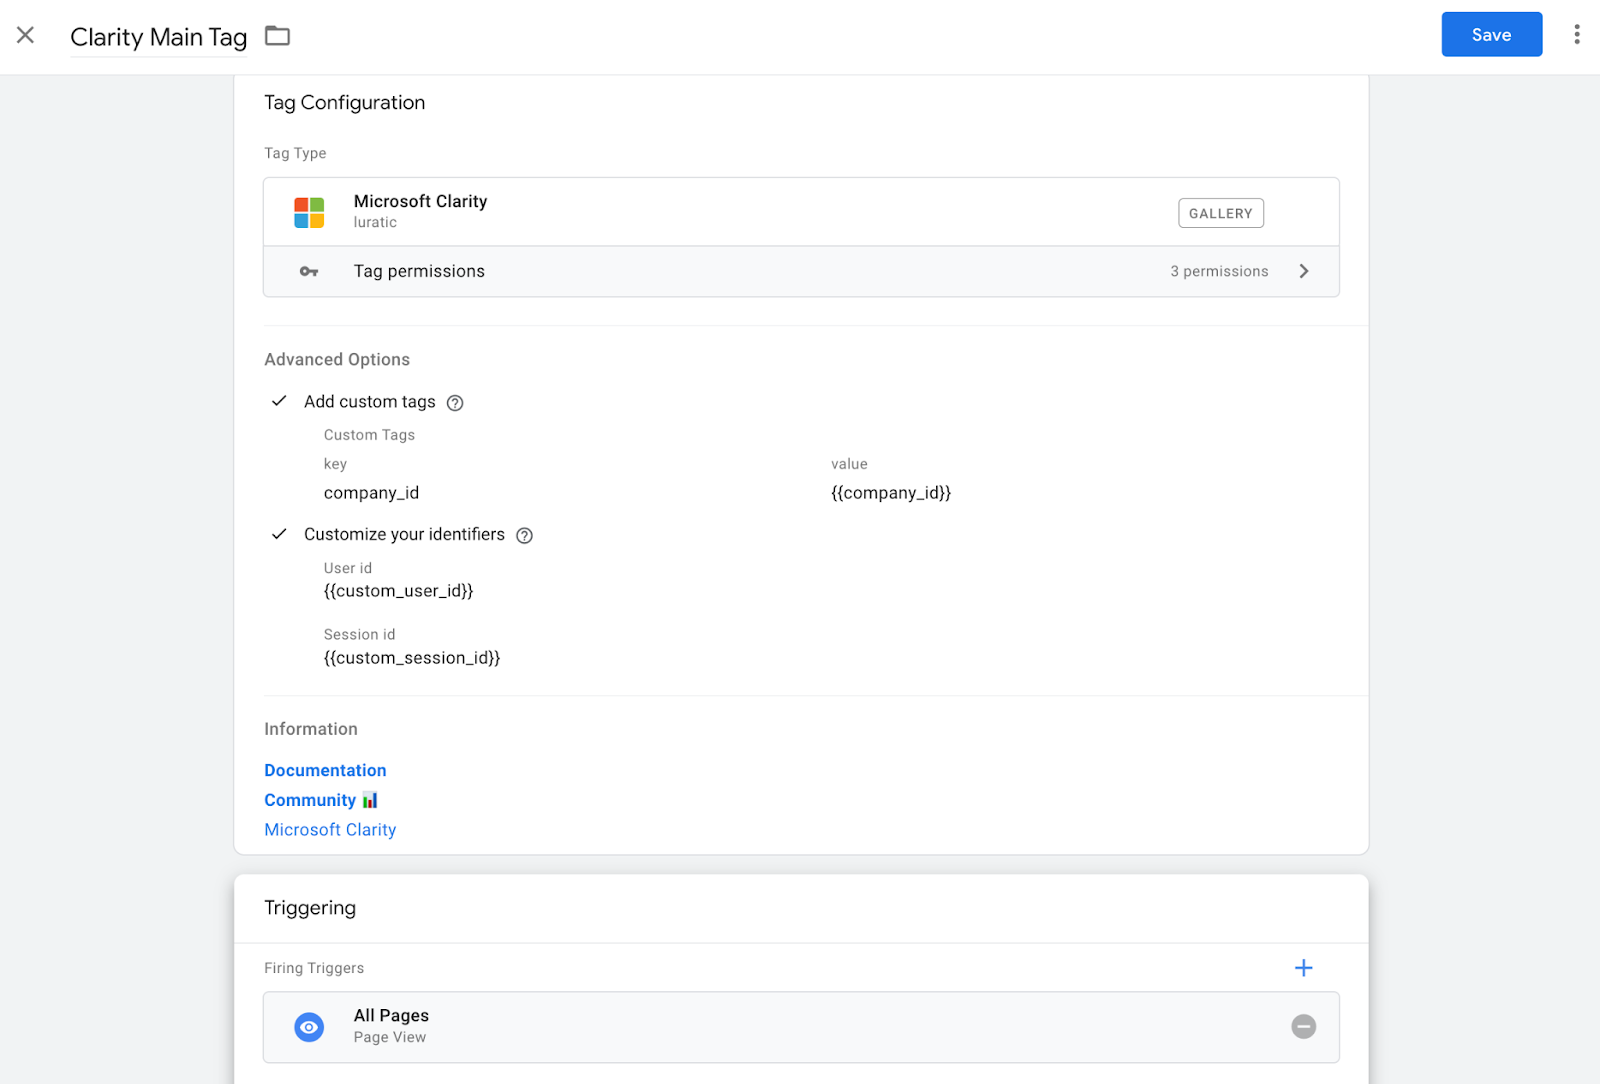
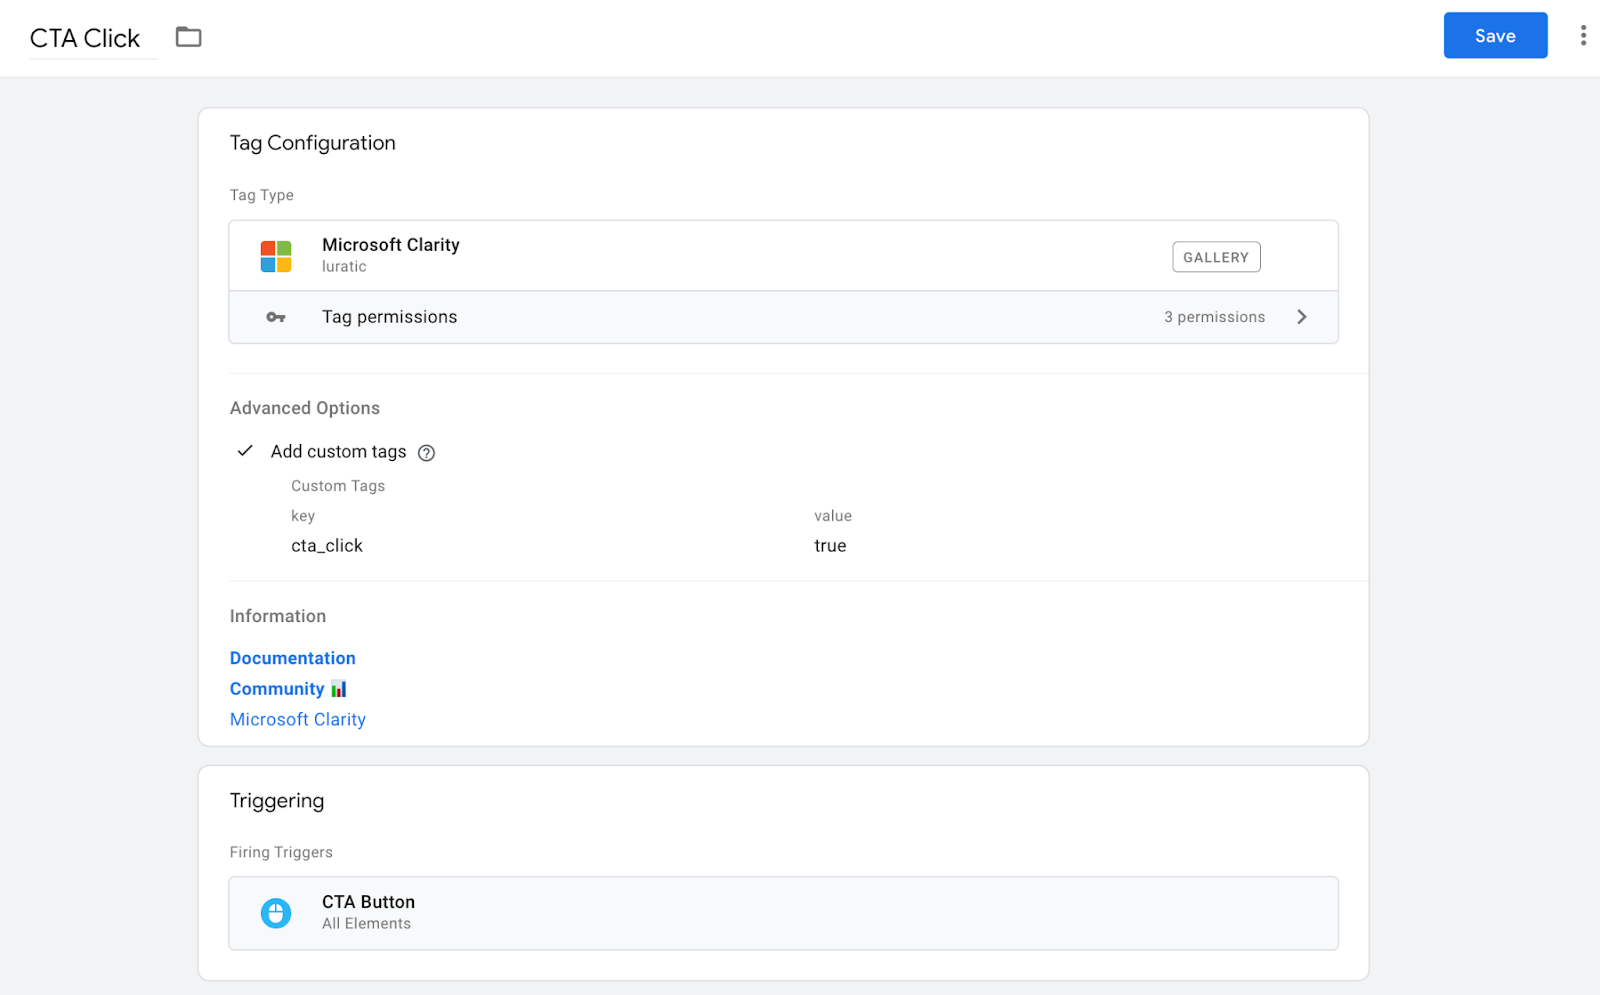
Additionally, its compatibility with mobile apps distinguishes it from competitors, though it may not be the best fit for sites handling sensitive data particularly those in healthcare, financial services, or government sectors. It’s designed to deliver insights into user interactions without impacting site performance, thanks to its GDPR and CCPA readiness and no sampling policy. Clarity’s heatmaps and live recordings are instant, comprehensive, and respect user privacy settings, making it a go-to for businesses seeking immediate and actionable data. With an easy installation process, fast data refresh, numerous integrations and a seamless companion to Google Analytics, Microsoft Clarity emerges as a top solution, democratizing access to powerful analytics. 
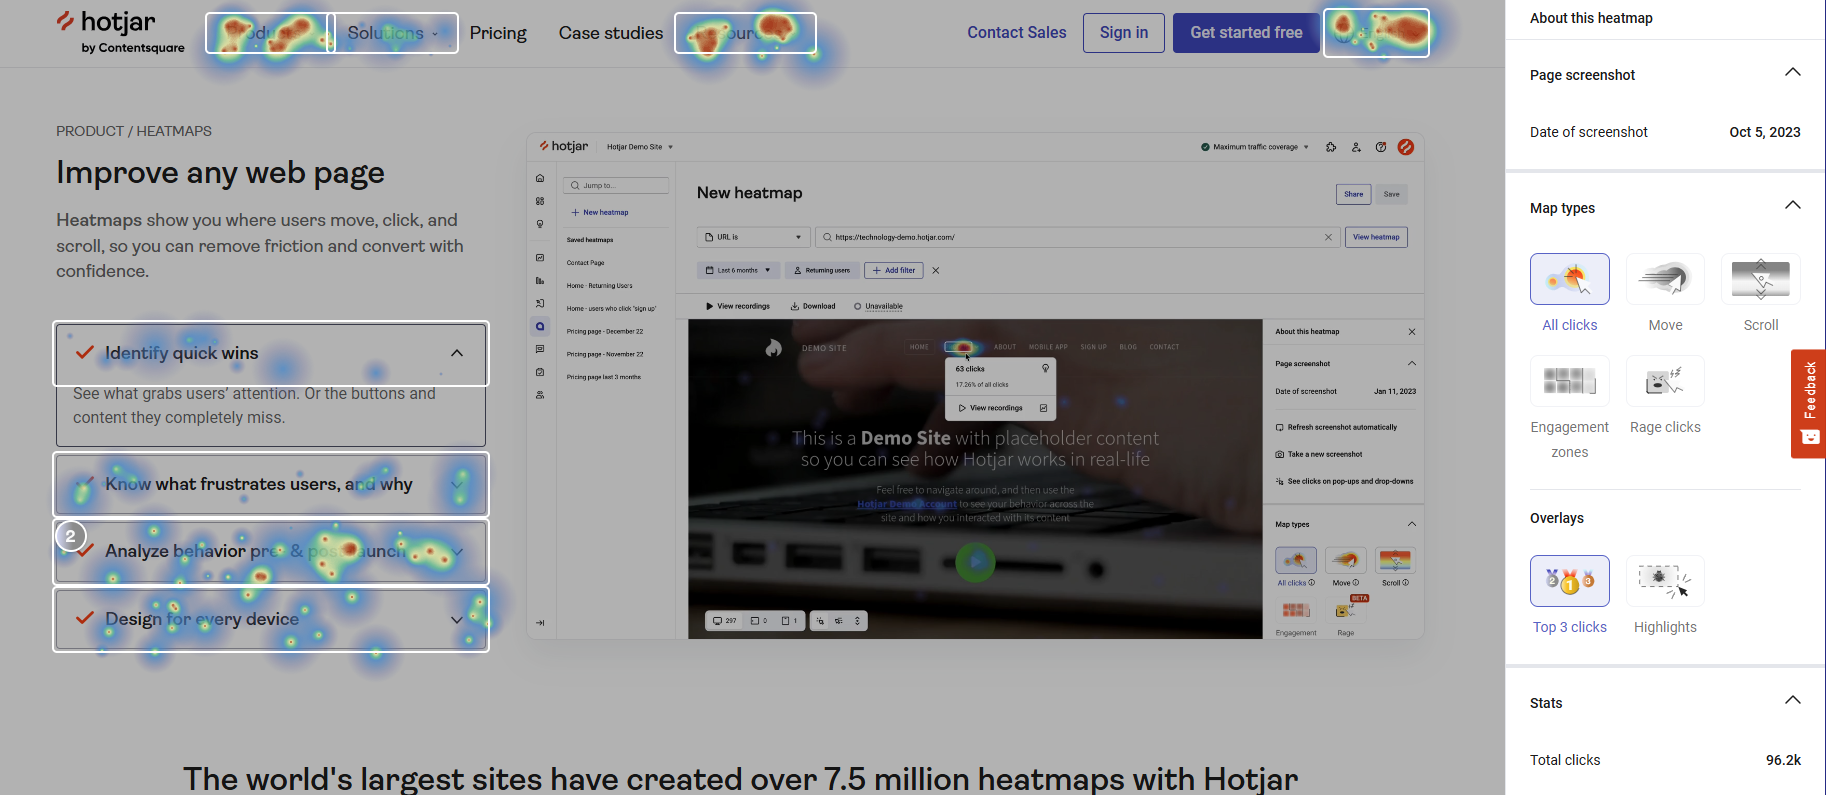
Hotjar 

Hotjar steps up with a suite of tools that go beyond heatmaps and session recordings. It includes feedback widgets, surveys, and even user interviews, making it a one-stop-shop for understanding your audience. With a free plan available, Hotjar is accessible, though it does have session limits. Paid plans range from $32 a month to over $500 a month depending on what features you want. Team collaboration is a breeze with Hotjar, thanks to its integration with tools like Slack, Jira, and Microsoft Teams. 

A dedicated support team and compatibility with various analytics platforms mean you’re never left in the dark. Hotjar’s privacy-first approach ensures that user data is handled with care, giving you and your users peace of mind. 
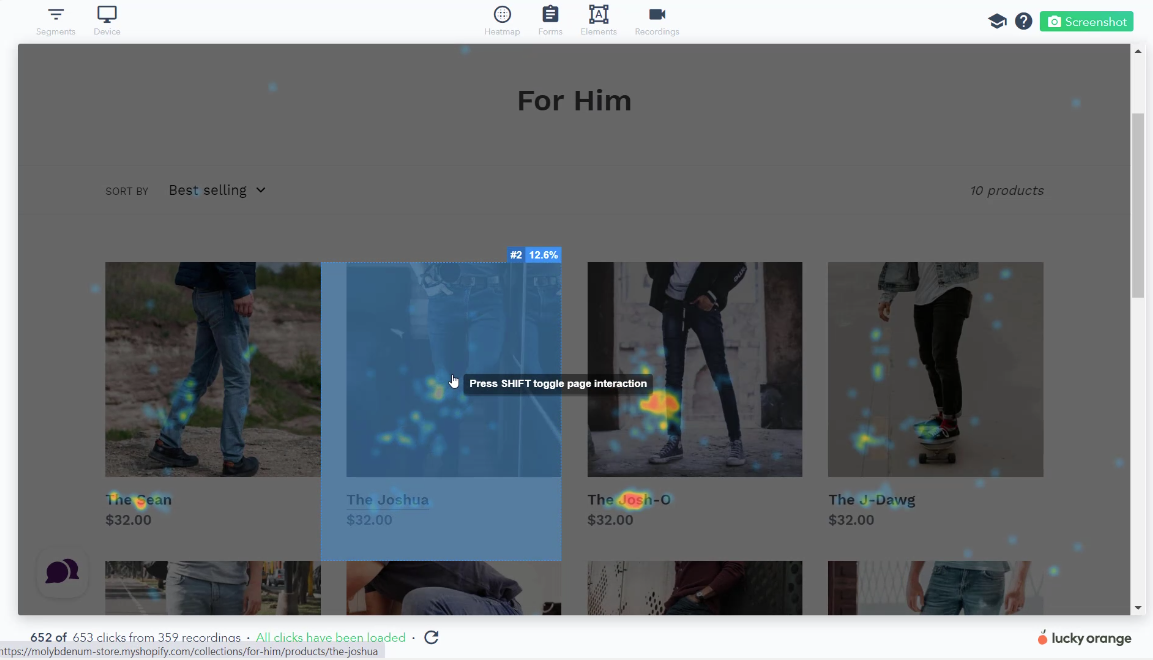
Lucky Orange 

Lucky Orange provides a robust set of tools for website analytics, including heatmaps, session recordings, and conversion funnels. It stands out with its real-time analytics and interaction tracking, which can give you immediate insights into user behavior. Lucky Orange also offers additional features like chat popups and survey popups, which can enhance user engagement. Its range of features and focus on conversion funnels make it a strong contender for e-commerce and B2B companies.

While Lucky Orange is not free, it does offer a range of pricing plans starting at $39 per month. Users appreciate its ease of use and the funnel feature, which is particularly useful for e-commerce sites. However, some users have noted that the load time can be slow, and the default alert sound for user visits can be annoying.
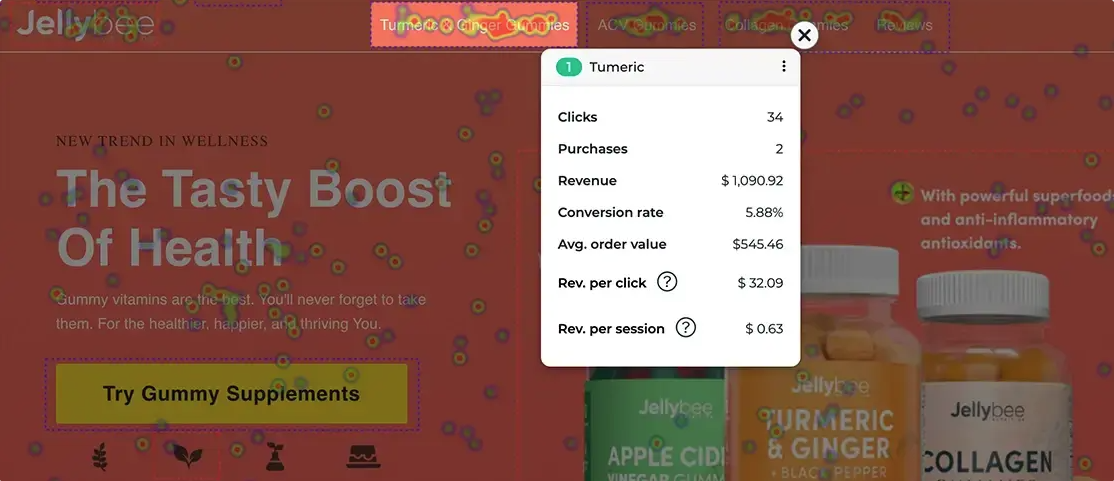
Heatmap.com 

Heatmap.com, although a newer entrant, is quickly making a name for itself. It supports a variety of platforms and caters to companies of all sizes looking to delve deeper into their website visitor behavior. With a focus on heatmap features, it offers behavioral mapping, dynamic maps, and element analytics. Heatmaps.com integrates with popular services like ClickFunnels and Shopify, positioning itself as a versatile tool for e-commerce and marketing professionals.

For those who value a fresh approach with a focus on detailed heatmap analytics and integration with e-commerce platforms, Heatmap.com is worth considering. This platform brings valuable insights to the table, enabling businesses to enhance their online presence and user experience through its unique features.

Conclusion

In comparing Microsoft Clarity with other analytics tools like Hotjar, Lucky Orange and Heatmaps.com, Clarity remains a strong contender due to its cost-effectiveness and comprehensive analytics capabilities. Clarity’s robust feature set, including mobile app analysis, makes it an attractive option for those on a budget. The ability to analyze both web and mobile app data is a significant advantage. In summary, Microsoft Clarity is a compelling option for anyone needing a no-cost, powerful analytics solution. As the analytics space evolves, the choice between each of these tool’s hinge on the balance of cost, features, and the depth of insights required. If you are looking for a data and behavioral analytics tool that can help you understand your visitors better and improve your website performance, you should give Microsoft Clarity a try. 

How to Boost Your Productivity with Microsoft Clarity: 10 Tips for World Productivity Day 

How to Boost Your Productivity with Microsoft Clarity: 10 Tips for World Productivity Day 

Today is World Productivity Day—a global celebration of the value of efficiency and effectiveness in work and life. One of the main goals of Microsoft Clarity is to help increase user productivity by streamlining your data so you can make your website run more efficiently. Clarity gives you the power to turn data into strategic and informed decisions. By analyzing your website traffic, user behavior, and conversion rates with easy-to-use features such as heatmaps, session recordings, and insights dashboard. In this blog post, we will share 10 ways to use Microsoft Clarity to improve your website productivity and achieve your goals.

10 Ways to Use Microsoft Clarity to Boost Your Productivity 

  1. Utilize Copilot within Clarity: To make data analysis easier and faster for you, we’ve integrated a suite of Copilot features to help you skip directly to the important info. We offer three Copilot summarization features (and an upcoming Chat feature soon!). These features all incorporate generative AI through Large Language Models (LLMs), the same technology that underpins Copilot. Streamline your data analysis and boost productivity!  
  1. Use heatmaps: Instead of guessing what your most clicked elements are, you can use heatmaps to get actual click data which you can use to make improvements across your site to make it more efficient and make you more productive! 
  1. Watch session recordings: By observing how visitors interact with your website in real-time, you can gain insights into user behavior, navigation patterns, and potential obstacles they encounter.  
  1. Filter your data: Microsoft Clarity allows you to segment your audience by various criteria such as device type, browser, and location, enabling you to tailor your strategies to different user groups. 
  1. Use the insights dashboard: The dashboard gives you a quick overview of key performance indicators, user behavior, and conversion metrics, helping you make informed decisions. You can even customize it to your liking allowing you to focus on the things you care about! 
  1. Discover popular and least popular pages: Understanding which pages drive engagement and which contribute to high bounce and exit rates can inform content and design strategies saving you time & money! 
  1. Identify common issues and errors: Clarity can help you pinpoint technical problems or design flaws that negatively affect user experience and satisfaction.  
  1. A/B testing feature: Test different versions of your web pages to see which one performs better in terms of user engagement and conversion rates through integrations with A/B tasty and by using compare heatmaps.
  1. Integrate with other Microsoft products: Enhance your insights by connecting Clarity with tools like Bing Webmaster Tools, Microsoft Advertising, and Microsoft 365—and many more! 
  1. Share reports and insights: Easily share Clarity reports with your team or collaborators through a link or email to make collective data-driven decisions—teamwork makes the dream work! 

Our vision is to help the world act on its data. Gathering meaningful insights from existing analytics solutions isn’t easy. They all report a ton of data, and yet simple questions can take forever to answer. They are seemingly designed for data analysts with a lot of time and technical resources, leaving all other users frustrated. Clarity was created to close this gap and disrupt the market with intuitive, visual analytics for everyone so they can all achieve more with data.   

Try Microsoft Clarity today and see how it can help you achieve your website goals and celebrate World Productivity Day! 

Unlocking New Insights: Microsoft Clarity Now Integrated with HubSpot 

Unlocking New Insights: Microsoft Clarity Now Integrated with HubSpot 

In the dynamic world of digital marketing and sales, understanding user behavior is paramount. We’re always looking for ways to enhance your experience and provide deeper insights into your user interactions. Today, we are thrilled to announce an exciting new feature that takes user analysis to the next level – Clarity’s integration with HubSpot

Why This Integration Matters 

Microsoft Clarity’s integration with HubSpot is a game-changer for businesses looking to gain a competitive edge. By combining Clarity’s robust session recording capabilities with HubSpot’s powerful CRM and marketing automation tools, you can now achieve a holistic view of your customer journey. 

Key Benefits of the Integration 

  1. Enhanced User Insights: With Clarity integrated into HubSpot, you can effortlessly access session recordings directly from your HubSpot contact timeline. This means you can see exactly how users are interacting with your site, identify pain points, and understand their behavior in real-time. 

Example: Imagine a user fills out a form on your website but doesn’t proceed to make a purchase. With Clarity’s session recordings available in HubSpot, you can watch the user’s journey, pinpoint where they encountered issues, and take steps to optimize that part of the process. 

  1. Streamlined Workflow: No more toggling between different platforms. With this integration, all the data you need is in one place. This not only saves time but also allows for more cohesive and informed decision-making. 

Example: Your sales team can now see how leads are interacting with your website, directly within HubSpot. This context allows them to tailor their outreach, making conversations more relevant and increasing the chances of conversion. 

  1. Better Preparedness: By having a comprehensive view of user behavior, your marketing and sales teams are better prepared for interactions with potential customers. Use the insights gained from Clarity to refine your strategies and improve your overall user experience. 

Example: Suppose a particular landing page isn’t performing well. With the integration, you can analyze user behavior on that page through Clarity’s recordings, identify the problem areas, and optimize the page accordingly – all while keeping your team in the loop via HubSpot. 

How to Get Started 

Getting started with the Clarity and HubSpot integration is simple and straightforward: 

  1. From Clarity: 
  • Go to your Clarity project settings. 
  • Navigate to the integrations tab and activate HubSpot. 
  • Choose the HubSpot project that you want to link with Clarity. 
  1. From HubSpot: 
  • Go to the Contacts hub and select a created contact 
  • Open the filters and ensure that Microsoft Clarity is chosen. 
  • You can now view session recordings of your contacts directly in HubSpot. 

This seamless integration ensures that you have all the information you need to make data-driven decisions and improve your user engagement and conversion rates. 

Join the Revolution 

We are incredibly excited about this integration and believe it will bring immense value to your business. Whether you’re in marketing, sales, or customer support, the combined power of Microsoft Clarity and HubSpot will provide you with the insights you need to drive success. 

Learn more about the Clarity x HubSpot integration in our documentation and try it out for yourself! 

Announcing Copilot on Clarity Mobile App Projects

Announcing Copilot on Clarity Mobile App Projects

Following its introduction to Clarity web projects, we’re thrilled to introduce that Copilot is now available for Microsoft Clarity SDKs projects as well. Our mission has always been to democratize analytics and help the world act on its data, and Copilot is our next big leap toward achieving that goal. 

How can Copilot + Clarity help me understand user behavior? 

There are two ways by which you can currently use Copilot features on Clarity projects:

  1. Session Insights
  2. Grouped session insights

Session Insights

Session replays provide valuable insights into user journeys on your website. However, reviewing numerous sessions can be time-consuming. Copilot generates key takeaways from session replays using Generative AI, saving you time and boosting productivity. 

To use it, simply click on the Summarize icon in the individual recording:  

Then view the session insights and key takeaways in the left side panel:

For more information, visit our documentation here.  

Grouped Session insights  

With grouped session insights, multiple session recordings are summarized at the same time. This feature allows you to extract key patterns briefly and pinpoint the recordings that are worth watching.  

To use it, simply click on the Summarize recordings icon on the top right of the Recordings panel:

Then view the grouped session insights in the left side panel:

Pro tip: if you have a specific segment of users you’d like to summarize, filter to that group first and select the “Top 10 recordings” option.   

For more information, visit our documentation here.  

But wait, there’s more! We’re committed to continuous improvement. As we develop Copilot features, we want to keep you in the loop! Your feedback and suggestions will shape our journey, and together, we’ll redefine how data works for you. 

Some of the exciting new features that are coming to Copilot on Clarity for mobile apps soon are: 

  1. Heatmaps insights*: The Heatmap insights feature allows for you to summarize across multiple heatmaps for any app screen. Copilot parses through the taps heatmaps and across aggregated user sessions for a specific screen, and outputs a descriptive summary. This means you get a more complete understanding of the aggregated user behavior of your app in just seconds.  

*This feature is already available for web projects and is coming soon to mobile apps projects. 

  1. Clarity Chat: With natural language querying, you can now look up your Clarity project and receive concise summaries. Copilot helps you explore your data faster and more efficiently, empowering you to make informed decisions. 

Copilot in Clarity is a game-changer, and we can’t wait to see how it transforms your analytics experience. Read more about Copilot and Clarity in our recent blog post here! If you have any questions or need assistance, feel free to reach out. Let’s make data accessible and actionable together!

Ready to experience Copilot on Clarity? Sign up for Microsoft Clarity today and embark on a data-driven adventure!

Elevate Your Analysis: Using Filters and Segments in Microsoft Clarity

Elevate Your Analysis: Using Filters and Segments in Microsoft Clarity

I’ve mentioned a few times in previous articles that what makes Microsoft Clarity so wonderful is its simplicity. But don’t get me wrong, there are still plenty of advanced and powerful features.

In my opinion, one of the best features Clarity has to offer is its ability to filter any and all data by any criteria you want and then save those conditions for later use as Segments. Heatmaps, Session Recordings, and Dashboards can all be used with these Segments and Filters.

The filtering section gives you a variety of conditions to break down your data. The categories include user info, user actions, path, traffic, performance, session, page, and custom filters. These filters can be combined to really refine your conditions.

Filters panel showing data

Let’s dive a bit deeper into each section.

User Info 

The User Info filters include user attributes and details about the user, such as the device they were on when visiting the website or their location. You can also filter by specific time frames in this section.

User info panel showing data

User Actions 

The User Actions section focuses on actions a user has taken on the website. This includes click actions like rage clicks or scroll percentages. You can also add specific text that a user clicked (such as CTA text). If you’ve built smart events, you can include them as an option as well, so events like purchases and form fills will show up here. This can be super useful for drilling down to users who have added items to their cart but haven’t purchased or other key actions on your website. Another option is great for publishers: Clarity allows you to filter by reader type and reading behavior. You can find users who engaged with multiple articles or filter by whether they just saw a headline or finished the article. 

User actions panel showing data

Path

Next up is pathway filtering. This filter allows you to select a URL or series of URLs that the user visited. You can include or exclude the URL, and there’s an option for regex, making it easy to build complex URL conditions. Just remember that the condition is restricted to the date range selected in the User Info section, so they would need to have visited the URL in the last three days in this example. On Session Recordings and Dashboards, you can also drill down by exit and entry pages.

Path fields

Traffic 

The Traffic section allows you to drill down specific criteria surrounding where a user came from before they got to your website. This data is based on either referral traffic or UTM criteria.

Traffic field data

Performance 

Performance allows you to compare audiences of users who have had different site-speed experiences. This enables you to determine whether site speed is having an impact on traffic and user behavior

Performance fields data

Session 

This section which is only available on Session Recording & Dashboards, allows you to drill down by criteria surrounding a visit on the website. You can drill down by how long a user was on the site, how many times they engaged, or how many pages they went to. This can be a great section when combined with grouped session trends.  

Sessions field data

Page

Similar to Session, this section focuses on behavior but tailored to a specific page. You can filter by duration or click count on a page. You can also filter by specific errors a user experienced on a page (great for debugging), how large a page was, or if it was visible or hidden behind another tab.

Page fields data

Custom filters 

This section allows for infinite customization. You can use a tool like GTM to tag and send in custom filtering criteria. Examples include audience_ids, company_ids, A/B test groups, custom actions, content groupings, and more! Anything you can dream up and implement. Beyond tagging, you can leverage GTM or the Clarity Client API to send in custom user_ids (from your CDP), session ids, and page ids. This opens up a world of possibilities and can help you get the most out of features including CoPilot.custim filter data

The easiest way to leverage custom filters is to use the Luratic Microsoft Clarity Template in GTM. Using this template, you can either add variables to the different filter fields globally 

Tag configuration data

or choose specific events to fire custom filters on.

Tag configuration data cont

Saving Criteria & Creating Segments

Once you’ve selected your criteria (in this example, we’ll use Mobile Traffic that came from Organic Search in the last 30 days), you can save your criteria. saving criteria

After applying those filters, they will be available in any tab you go to (Heatmaps, Session Recordings, Dashboards) as long as they are compatible with the tab.

If you intend to use these filter criteria again and again, your next step would be to save them as a segment. Once you save it as a segment, you can name your user group.

save as segment highlighted

Image shows "New segment" modal with Segment name as a text entry, and filters section which shows the list of filters that will be included in this segment. There is also a save and close button.,. 

It will now be available in your saved segments to use as you’d like! Image shows segments panel, which lists your segments with their title and list of filters they will apply.

These Segments and Filters can be super useful for ultimate flexible analysis. They allow you to dive deep into any condition and get the most out of your Clarity data. And just remember, Copilot observes the data you filter as well, so it’s an easy path to getting the most out of the AI analysis features. Now that you have these tools at your fingertips, I encourage you to play around and explore! Until next time! Happy customizing!!

Check out more about using filters and segments in my deep dive video below!

Introducing Funnels in Clarity! 

Introducing Funnels in Clarity! 

We heard your feedback and are happy to announce that funnels are coming to Clarity! Now you can easily track the steps users take before reaching a goal or conversion. 

What are funnels? 

  • Funnels are simply an ordered group of actions a user takes before converting or completing a goal. For example, a checkout funnel for an e-commerce website could include add to cart, begin checkout, and then purchase. 

Why are funnels useful? 

  • Funnels are useful because they show how users progress through a specific flow and how many sessions convert or drop off between steps. This lets you identify specific pages or areas where users struggle the most. You can use this information to make improvements to the funnel steps and increase conversion rates! 

Creating a funnel

  • Creating funnels in Clarity is super simple! From the settings page, simply add smart events or URL visits to a funnel, enter a name, and click save. 

Using funnels 

  • Once you create a funnel, you can view it in the dashboard. Here you will see three key metrics as well as the chart itself. The top-level metrics are: 
    • Conversion rate: The percentage of sessions that complete the entire funnel 
    • Sessions converted: the number of sessions that complete the entire funnel 
    • Median time to convert: The median time it took to complete the funnel 
  • For each step, you will see the number of sessions that did or did not reach it. You can then view heatmaps and recordings at each point for more detailed analysis.
  • You can add a funnel step as a filter to better segment your data

See for yourself! 

Now that you’ve read about funnels, go try it out for yourself! Learn more about funnels in our documentation.

  1. Create your first funnel in settings. Just drag and drop! 
  1. Visualize conversions and drop-offs. Easily understand which steps of the funnel you need to improve the most 
  1. View heatmaps and recordings. Better understand what might be causing the issue and what improvements to make