The Easy Way to Optimize for Black Friday

The Easy Way to Optimize for Black Friday

The festive season is upon us and with it comes the much-anticipated shopping frenzy of Black Friday. As businesses gear up for this massive sales event, ensuring that your website is primed and ready to handle the surge in traffic and provide an optimal user experience is paramount. That’s where Microsoft Clarity, a powerful tool designed to give you insights into how visitors interact with your website, comes in to save the day. In this post, we’ll take a look at how Microsoft Clarity’s key features: Heatmaps, Session Recordings, and Dashboard Insights, can optimize your website’s performance during the Black Friday period and beyond. 

Heatmaps: Visualizing User Interactions

Image of Heatmaps on Microsoft Clarity

Heatmaps are a visual representation of where users click, move, and scroll on your website. By analyzing these patterns, you can identify which areas of your site are drawing the most attention and which might be overlooked. For Black Friday preparations, heatmaps can help you: 

– Pinpoint popular products or deals that users are gravitating towards. 

– Identify any navigation issues or bottlenecks that might hinder the shopping experience. Use rage click maps to find where users repletely click in an area, or dead click maps to see where users are clicking but not action is happening.

– Optimize the placement of promotional banners or call-to-action buttons to maximize conversions. 

 -Dig deeper into conversion data with Conversion Heatmaps for Shopify sites.

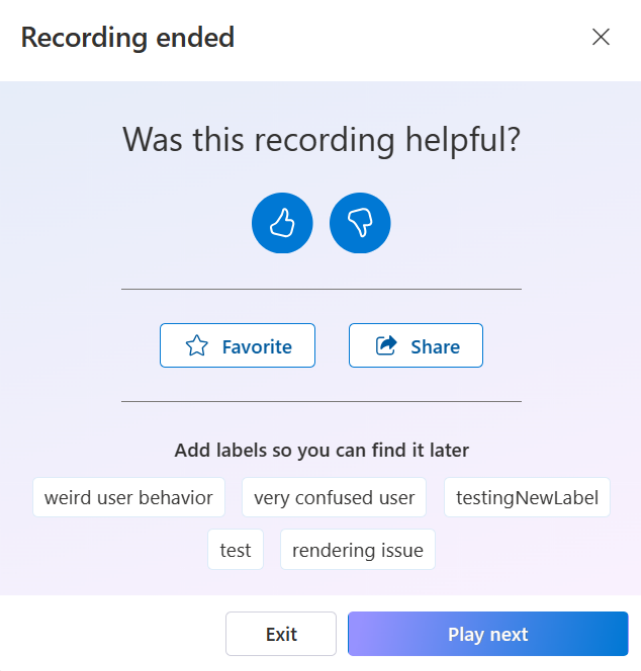
Session Recordings: A Deep Dive into User Behavior 

Session Recordings on Microsoft Clarity

Session recordings allow you to watch recordings of individual user sessions, providing a firsthand look at how visitors navigate your site. This feature is invaluable for: 

– Get AI analyzed session recordings with Session Takeaways to save time when you’re in a crunch!

– Understanding any challenges or obstacles users face while trying to make a purchase. 

– Gaining insights into the user journey, from landing on your site to checkout. 

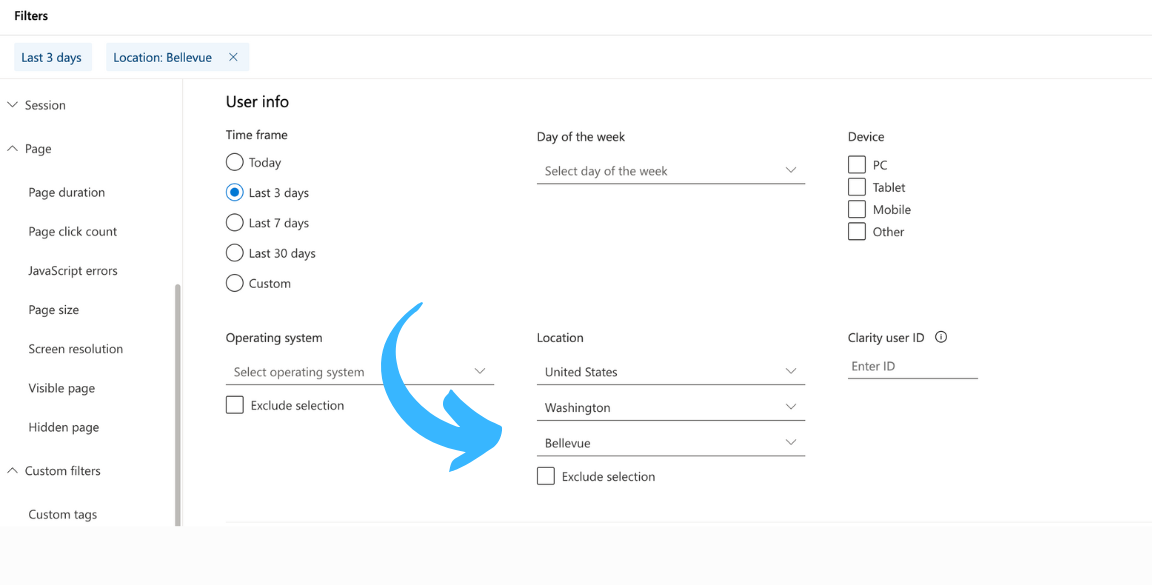
– Identifying any technical glitches or issues that might deter potential customers. This is easily achieved by using Clarity’s filtering to pinpoint recordings that have JavaScript errors.

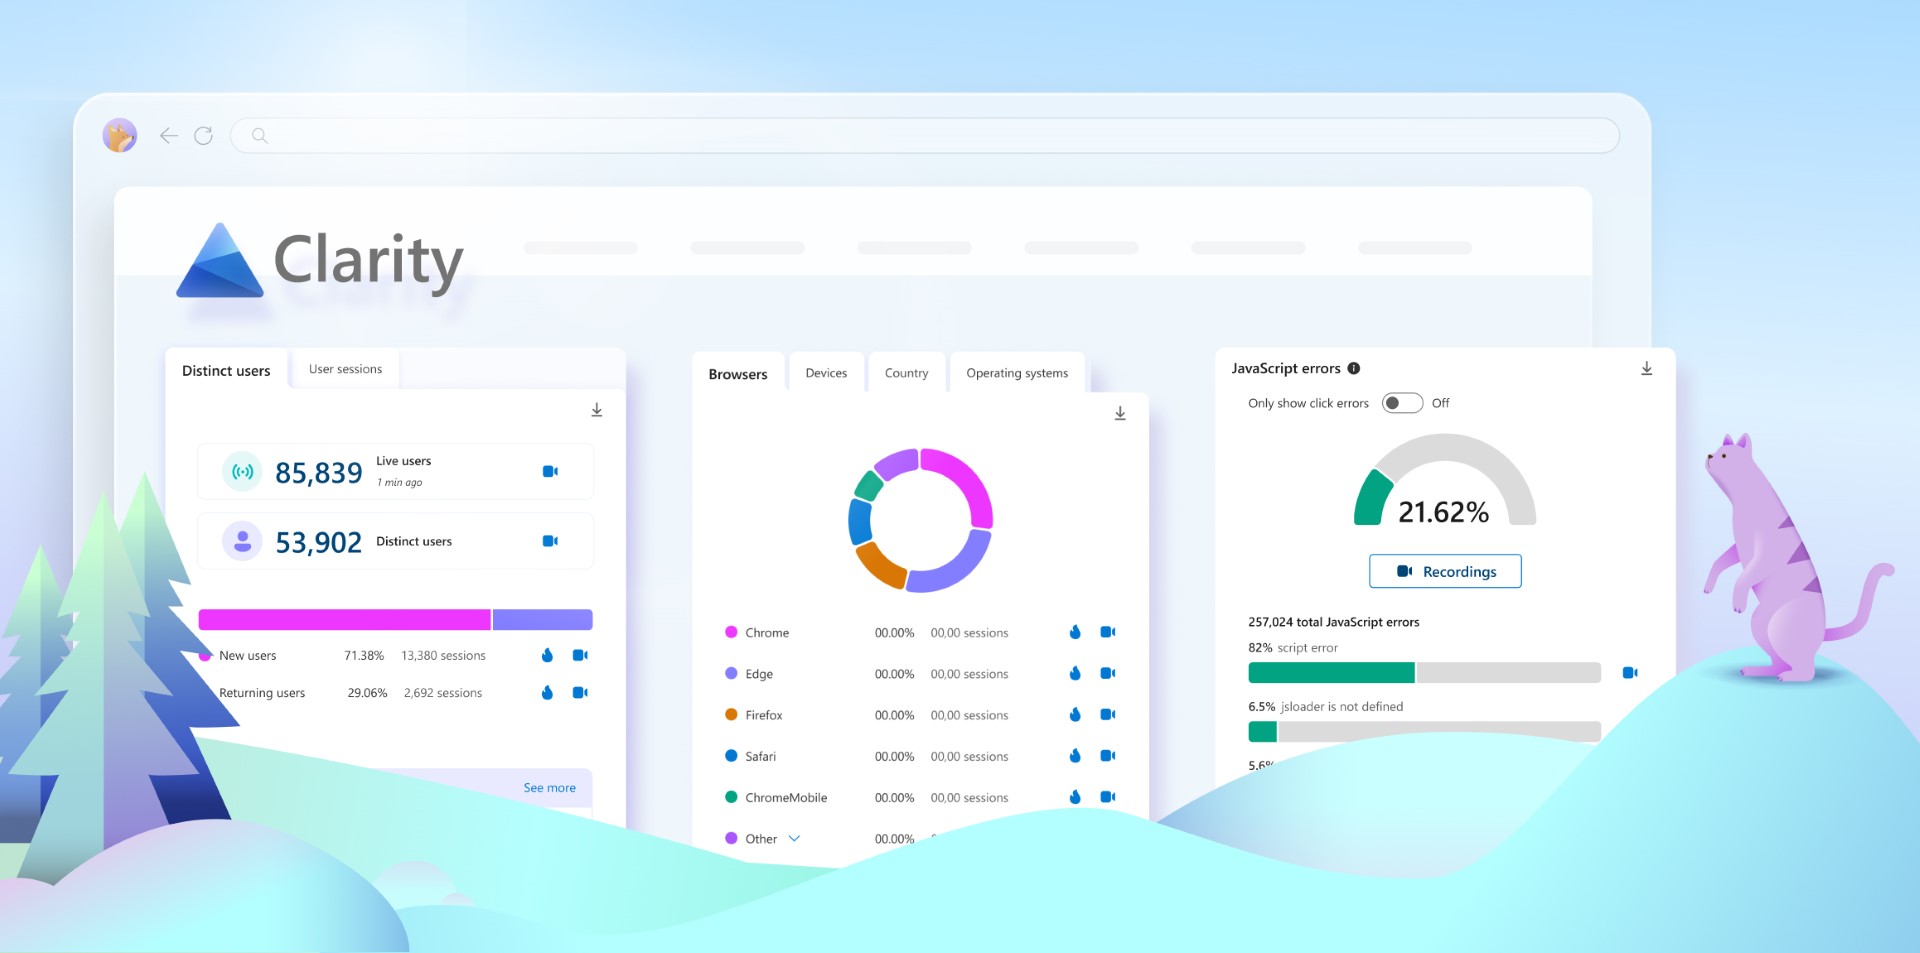
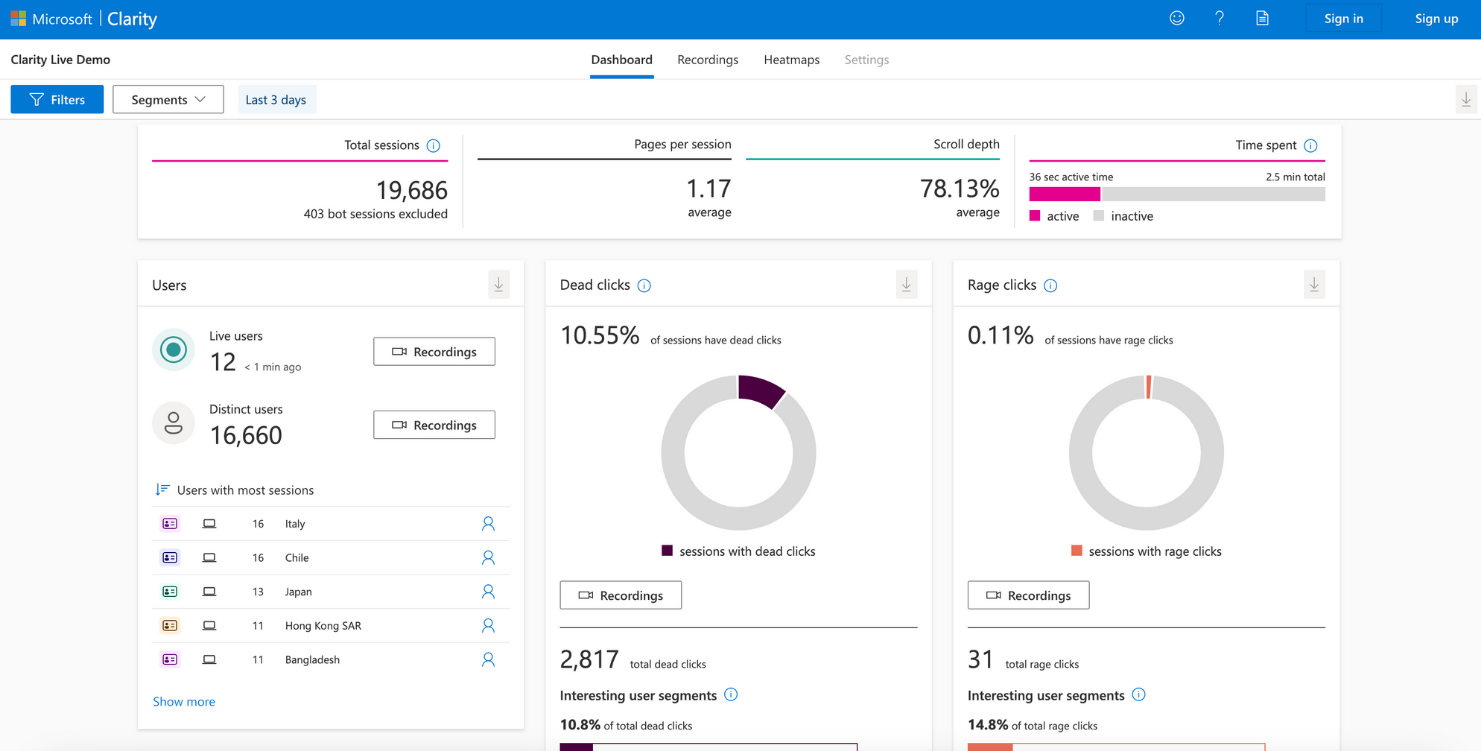
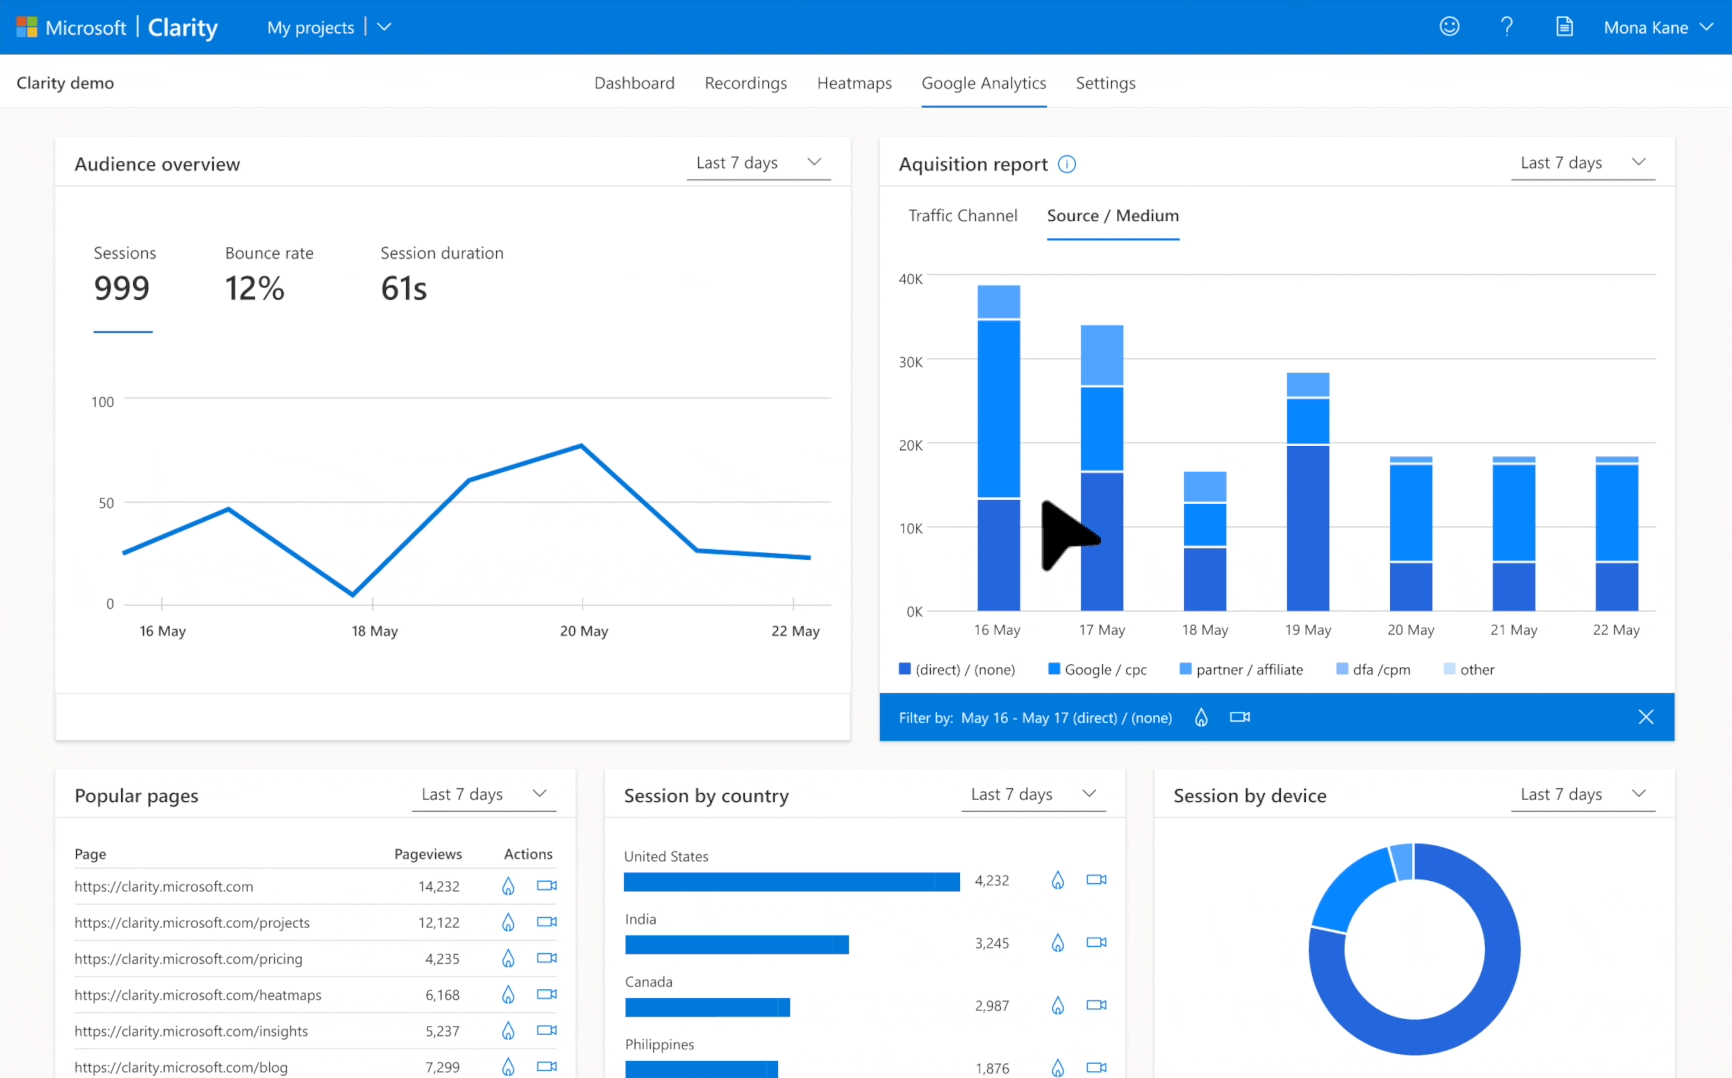
 Dashboard Insights: Comprehensive Data at Your Fingertips 

Dashboard insights on Microsoft Clarity

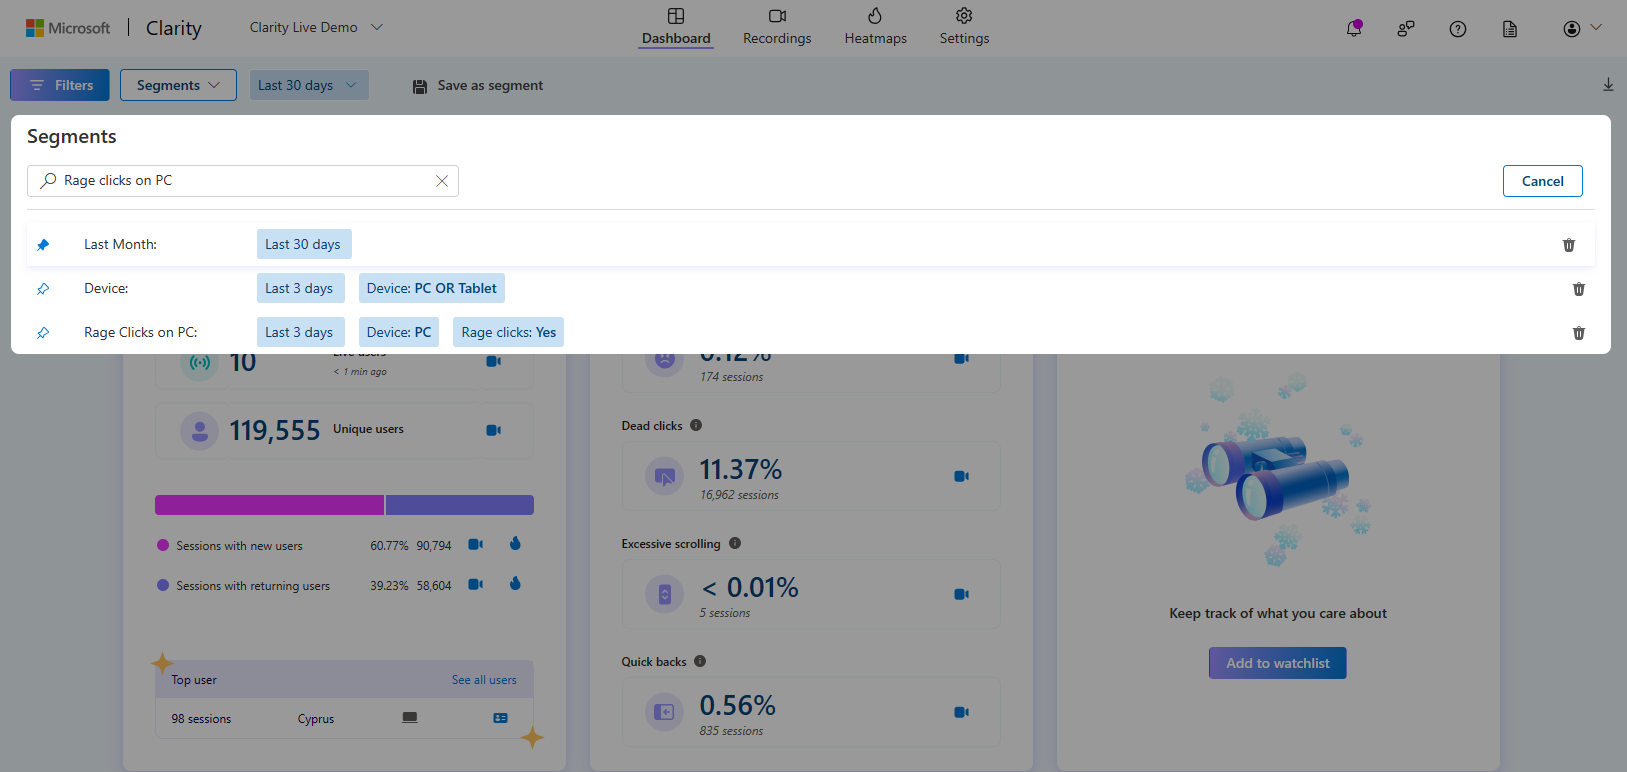
Microsoft Clarity’s dashboard provides a holistic view of your website’s performance metrics. As Black Friday approaches, regularly checking these insights can assist you in: 

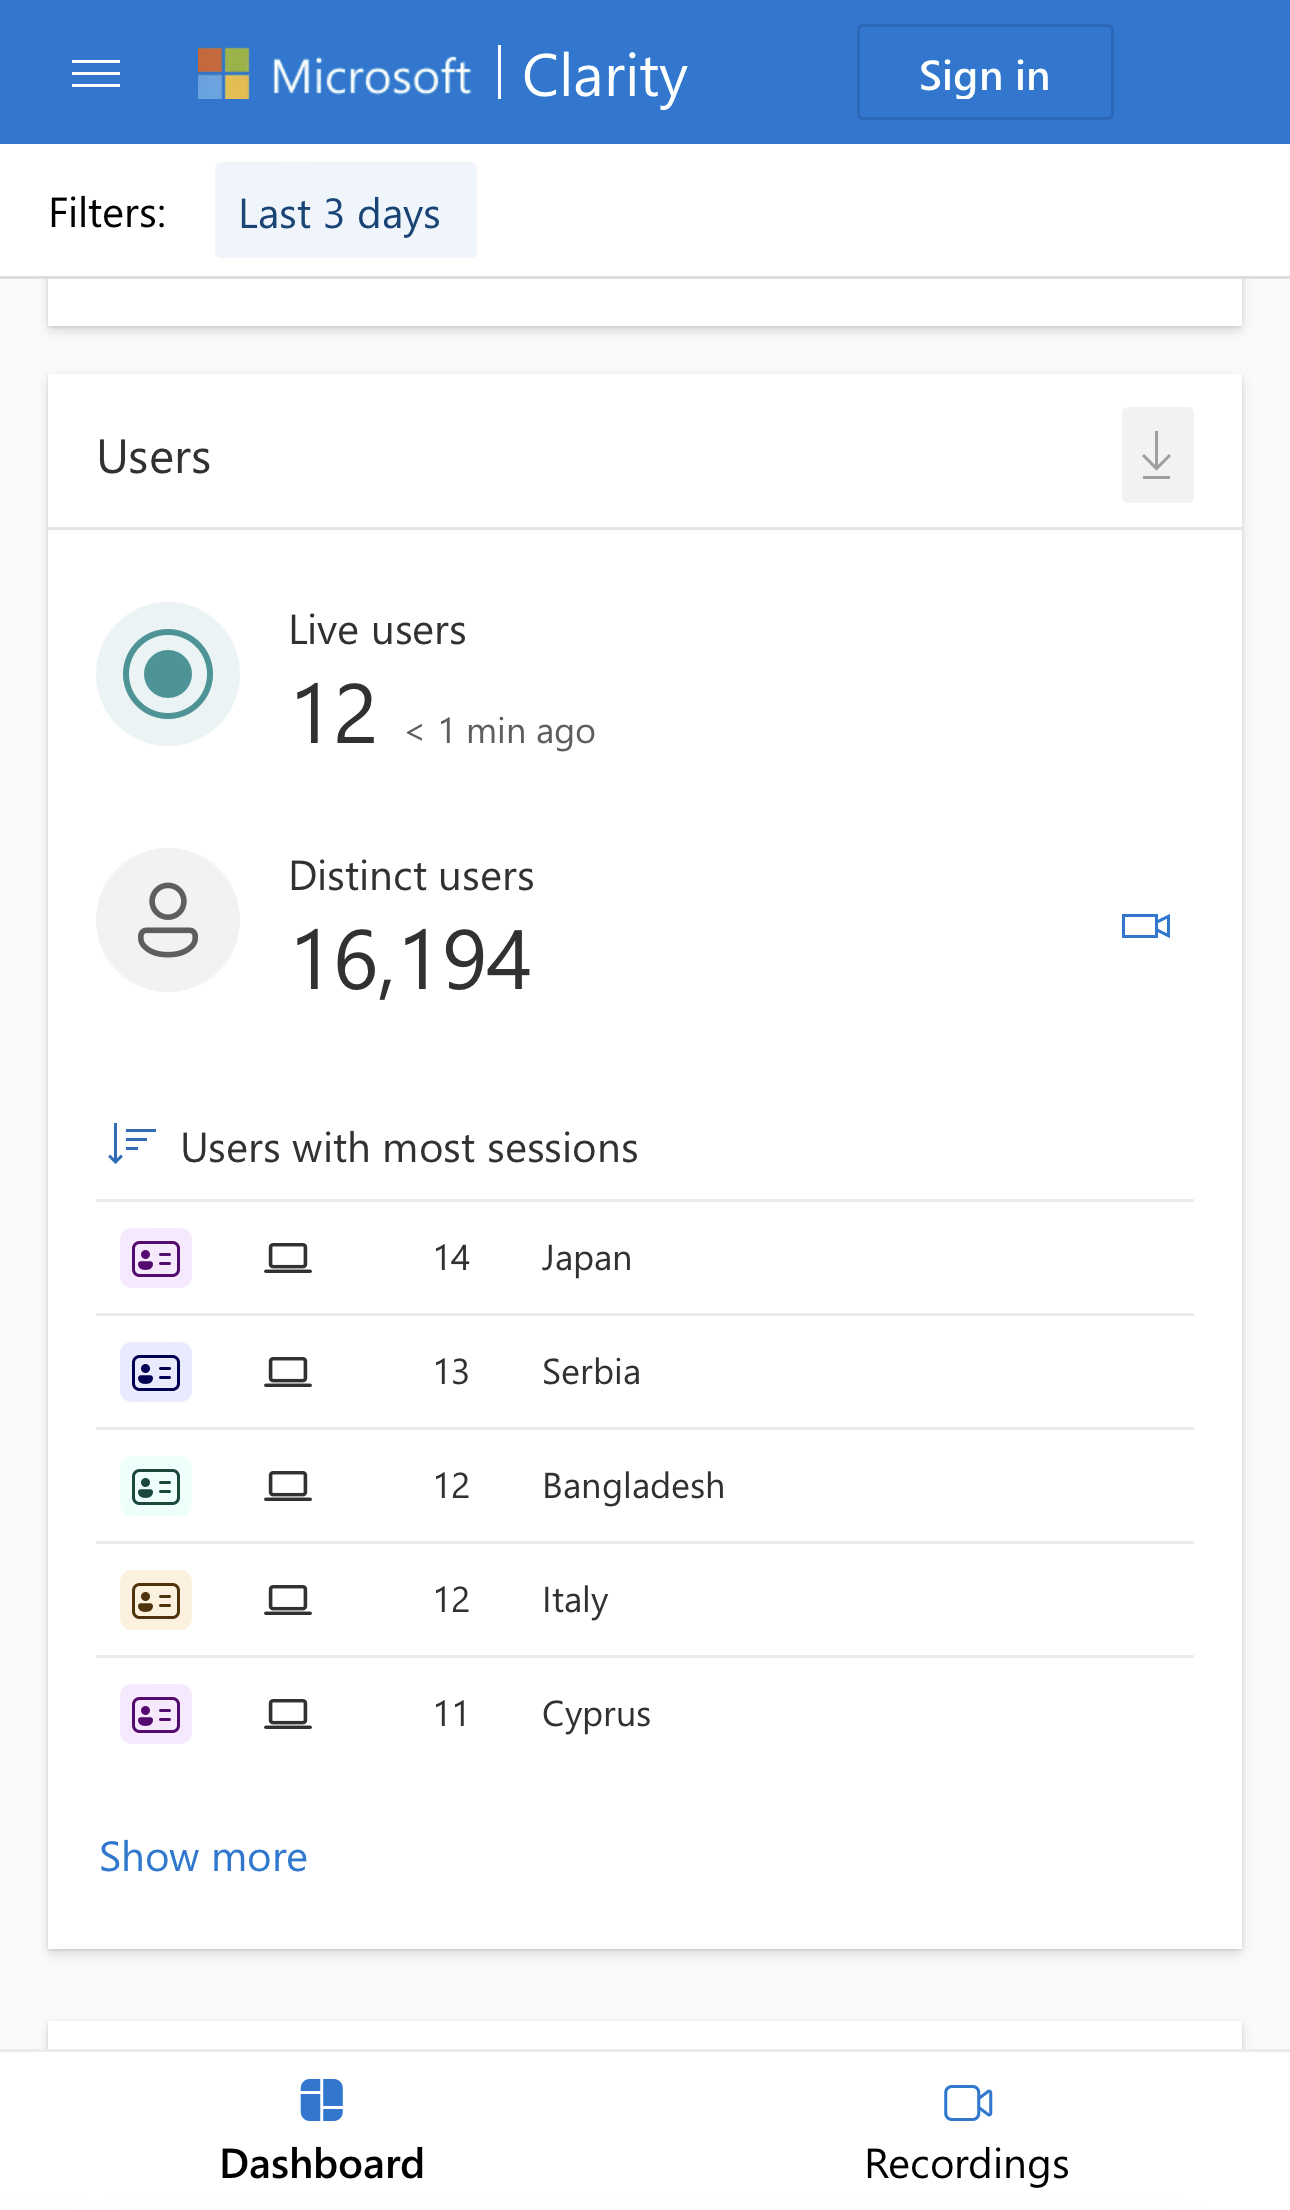
– Monitoring traffic spikes in real-time with Clarity Live User view to ensure your server can handle the increased load. 

– Tracking conversion rates and identifying any sudden drops or anomalies. 

– Gauging the effectiveness of your marketing campaigns and making necessary adjustments. 

 -Get e-commerce insights to stay in the loop on your biggest days of the year. If you’re seeing certain products perform better, you can quickly rearrange them to be the focal point on your website.

Black Friday is a golden opportunity for businesses to boost sales and attract new customers. With Microsoft Clarity at your disposal, you can ensure that your website is not only ready to handle the influx of visitors but also offers a seamless and enjoyable shopping experience. By harnessing the power of Heatmaps, Session Recordings, and Dashboard Insights, you’ll be well-equipped to make data-driven decisions to maximize your Black Friday success. 

Supercharge Clarity with the new Zapier Integration 

Supercharge Clarity with the new Zapier Integration 

Understanding user behavior is paramount to the success of any online platform. Clarity, a leading tool in behavioral analytics, offers invaluable insights into how users interact with websites. But what if we could amplify its power? Zapier, a central hub that connects over 2,000 apps, making integration seamless. By integrating Clarity with Zapier, the possibilities are endless. 

The Power of Integration 

The beauty of Clarity lies in its detailed metrics that shed light on user behavior. By integrating with Zapier, Clarity’s insights can be easily connected to a myriad of other applications. Whether it’s sending data to a CRM, triggering emails, or updating spreadsheets, Zapier acts as a bridge, making these tasks effortless. 

Key Features & Metrics Microsoft Clarity Offers 

To truly appreciate the Clarity-Zapier integration, it’s essential to understand the metrics Clarity focuses on: 

Heatmaps – See at a glance which areas on your page drive the most engagement and how far your visitors scroll with Clarity instant heatmaps. 

Session Recordings – watch and learn beyond the numbers to see how people actually use your site. Find out what’s working, learn what needs to be fixed, and test out new ideas. 

Rage Clicks – Indicates user frustration when they repeatedly click on an element. 

Dead Clicks – Occurs when users click on an unresponsive element. 

JavaScript Errors – Highlights technical issues on the site. 

Excessive Scrolling – Suggests users might be having difficulty finding what they’re looking for. 

Quick Backs – Indicates users quickly returning to a previous page, suggesting dissatisfaction. 

Each metric offers a unique perspective, helping website owners pinpoint areas of improvement. Want to learn more about Clarity? Click here!

Benefits of the Clarity-Zapier Integration 

Clarity and Zapier Integration to automate workflows.

Real-time Monitoring – Stay updated with regular reports on your website’s performance. 

Automated Notifications – Say goodbye to manual checks. Zapier will notify you if any set threshold is met. 

Customizable Alerts – Tailor thresholds to your needs, ensuring you receive only the most pertinent alerts. 

Seamless Connectivity – With Zapier’s vast app ecosystem, you can connect Clarity to countless other tools, enhancing and streamlining your analysis process. 

If you’d like to learn more about this dynamic duo, we encourage you to read about the integration to fully understand the capabilities.

Setting Thresholds with Zapier 

One of the standout features of this integration is the ability to set thresholds for specific metrics. For instance, if you’ve identified that a 20% rage click rate is concerning, you can set this as a threshold in Zapier. Clarity will then send updates to Zapier every 6 hours, notifying if this threshold has been exceeded. This proactive approach ensures that you’re always in the loop, allowing for timely interventions. 

The integration of Clarity with Zapier is a game-changer for anyone serious about understanding and enhancing their user experience. By harnessing the combined power of these tools, you can stay ahead of issues, optimize your website, and provide an unparalleled user experience. Dive into this integration today and witness the transformation firsthand. 

Unveiling Enhanced Features: A Deeper Dive into the Redesign Launch 

Unveiling Enhanced Features: A Deeper Dive into the Redesign Launch 

We’re excited to share the latest enhancements that come with our redesigned platform. Brace yourselves for a seamless and enriched user experience as we introduce a slew of features that make Clarity even more powerful. Let’s explore these upgrades! 

Segments: Tailored for You

Segments is no longer just a feature; it’s a personalized experience. Pin your favorite segments to automatically apply them whenever you visit your Clarity project. For example, you can create a segment for the “Last 30 days” time frame. Once you pin it, you’ll see data for the last 30 days every time you return to Clarity. In addition, we added a search bar to make selecting the specific segment easier than ever. Its segmentation reimagined for your unique analytical needs.

Watchlist: Your Personalized Data

Introducing Watchlist, your go-to tool for personalized monitoring. Keep a close eye on the segments, custom tags, and labels that matter most to you. With customizable choices, you have the flexibility to curate your data universe, ensuring that nothing escapes your attention.  

Timestamp Share: Unleashing Precision in Sharing 

Say goodbye to vague references! With Timestamp Share, you can now pinpoint specific moments in session recordings and share them effortlessly. Whether it’s a crucial data point or an interesting discovery, your shared insights will make collaboration more effective than ever. 

Expanded Metrics: Uncovering Insights with Source, Channel, and More 

Explore your data in greater detail. We’ve added new dashboard views including Source, Channel, Campaign, and Referral, offering deeper insights into the origins and pathways of your data. This expanded toolkit ensures you have a comprehensive understanding of your data landscape, empowering you to make more informed decisions. 

New, Returning, and Top User

At a glance, gain a comprehensive understanding of your website’s audience dynamics. This feature visually breaks down the number of new visitors, returning loyalists, and even your top-engaged user. Quickly view heatmaps and session recordings so you can effortlessly track and analyze the pulse of your website’s user engagement, ensuring you’re always in tune with your audience’s behavior and preferences.

Improve Together

We’ve added a like/dislike option, conveniently available at the end of your session recordings. Your feedback is incredibly valuable to us. It allows us to elevate the quality of the session recordings we present to you, ensuring an even better and more tailored experience.

The redesign launch isn’t just a facelift; it’s an upgrade aimed at providing a more intuitive, powerful, and personalized experience. Embrace these features, explore their depths, and let the data-driven journey continue with newfound precision and insights. Thank you all for coming along on this journey as we continue to improve, grow, and build a loyal community!

Clarity Redesigned: Same Clarity you love, just better! 

Clarity Redesigned: Same Clarity you love, just better! 

Microsoft Clarity has received a fresh makeover, but it’s not just about the stylish new appearance. It’s a functional and visually pleasing enhancement to your workspace, designed with a focus on usability and coherence. So, what’s the buzz all about? Our aim is to make behavioral analytics accessible to everyone, and when we say everyone, we mean it. We’re democratizing data analytics, offering a free, user-friendly, and enjoyable experience for all. 

Don’t worry, though – we’re still the same Clarity you know and love. We’ve just made it even better! Now, let’s look at what we have in store for you! 

The most recognizable change you’ll see is our new design, a result of our creative team’s thoughtful and dedicated work. The UX design is filled with cool and cozy color tones that spark delight, innovation, and meaningfulness, evoking the three main pillars we strive to hit with every feature, fix, and futuristic concept we bring to life. 

BEFORE

AFTER

Microsoft Clarity’s greatest strengths is its simplicity. From start to finish everything about Clarity was built to be simple yet extremely powerful to eliminate the need to hire a developer, data analyst, or a UX designer to get amazing results. We guide you through the setup and implementation process, offer easily comprehensible charts and visualizations, and provide users with heatmaps and session recordings to optimize your website or app design. 

Time is precious. At Clarity, our mission is to enhance efficiency and accuracy. That’s why we’ve integrated automatic segments, advanced filters, and Microsoft’s AI Copilot into our platform. These features significantly reduce the time it takes to analyze your data, providing you with actionable results quickly. 

The modern design gives us the flexibility to match our experimental mindset and try radical features to push the boundary for behavioral analytics. With the addition of Copilot within Microsoft Clarity we have so many innovative features in the pipeline. The future of behavioral analytics is changing every day, and we intend to be the pioneers of this space.  

But don’t worry, we didn’t just redesign Clarity, we made improvements as well! Let’s take a quick look at a couple of them: 

Watchlist

Keep track of what you care about on your website. With Watchlist you’ll be able to do just that. Track segments, custom tags, and labels with this latest feature. 

Expanded Metrics

We had a lot of requests for this improvement, as promised, here it is! Now, easily toggle between referrals, channel, campaign, and source to get a granular look into your traffic.   

There are a few more improvements that have been launched with our redesign, if you want to learn about them all, click here

We have always been about creating a delightful experience for our users and we intend on keeping it that way forever. If you have been with Clarity since day one, then you have seen a ton of new features such as Clarity live extension, Clarity for Android SDK, Copilot in Microsoft Clarity, and so much more released on a regular basis. We listen to our users’ wants and needs through feedback on our social channels, and we can personally tell you it fuels our team to create the best behavioral analytics tool there is to offer.  

Live Users: Now on Mobile 

Live Users: Now on Mobile 

In today’s fast-paced digital world, understanding your website’s reach is crucial. For those who rely on real-time data to make informed decisions, we have exciting news for you. The much-anticipated “Live Users” feature, which was previously exclusive to desktop users, is now available on mobile! 

User Information on Mobile

This is our new mobile feature that allows you to see detailed user information on your website. We’re excited to tell you what exactly you can do with this below:

See Live Users: Get a real-time count of how many users are currently browsing your website. This feature is invaluable for marketers, website owners, and businesses who want to gauge their site’s immediate impact. 

View Distinct Users: Understand the unique reach of your website by seeing the number of distinct users. 

List All Users by Sessions: For those who love diving deep into analytics, you can now view a list of all users, sorted by the number of sessions they’ve had on your site. 

Why is Live User Count Important? 

The live user count is more than just a number. It’s a pulse check on your website’s activity. Whether you’ve just launched a new marketing campaign, released a new product, or published a viral blog post, the live user count lets you see the immediate response and engagement from your audience. 

With Clarity, you can also watch Live Recordings on your desktop to make sure everything is operating as it should. This is a great tool to use for product launches to make sure there are no bugs or pain points for your customers.  

Clarity Live Users: A Reliable Alternative for GA4 Users 

For those familiar with Google Analytics 4 (GA4) and its real-time reports, you might have encountered some challenges or inconsistencies. Clarity’s “Live Users” offers a robust and reliable alternative. It’s designed to deliver precise real-time data within a minute, whereas GA4 updates every thirty minutes, guaranteeing that you stay informed about your website’s performance without any delay.

 If you’re already a GA4 user, we have a simple integration with Google Analytics to have your data show up in inside your Microsoft Clarity dashboard.

The introduction of “Live Users” on mobile is a testament to our mission to be your go-to tool for behavioral analytics. This is a game changer for those who rely on real-time data. Whether you’re on the go or away from your desktop, you can now have the power of live analytics right at your fingertips. If you don’t have Microsoft Clarity on your website or app, it’s time to install and go live now! 

Clarity Monthly Recap [September 2023]

Clarity Monthly Recap [September 2023]

At Clarity, our dedicated team has been burning the midnight oil to ensure we deliver nothing short of excellence in our product. With each passing month, we embark on a journey of innovation, constantly unveiling new features, refining the existing ones, and squashing bugs to elevate your user experience to new heights.

While the major milestones certainly grab the spotlight, it’s the subtle, yet important enhancements that often go unnoticed. We believe that every detail matters, and that’s why we’ve decided to introduce our Monthly Recap. It’s our way of ensuring that you stay in the loop, never missing out on any of the exciting transformations happening behind the scenes. So, be prepared to be amazed, because with Clarity, there’s always something incredible happening just around the corner!

Conversion Heatmaps

We’re thrilled to unveil one of our most remarkable releases – a feature designed exclusively for Shopify store owners, aptly named “Conversion Heatmaps.” These dynamic Conversion Heatmaps provide invaluable insights into the elements that wield the power to drive purchase conversions. It’s your window into understanding precisely which website components are delivering the most significant value to you as a website owner.

But here’s the real magic: when you pair Conversion Heatmaps with our standard heatmaps, you gain a holistic view of your website’s performance. This synergy empowers you to optimize not just your conversions but also your user engagement, all in one fell swoop.

Ready to unlock the full potential of your Shopify store? Dive deeper into the world of Conversion Heatmaps by clicking here.

New Filters

Behold, a small but mighty addition to our filters – the ability to zero in on your traffic’s precise location, down to the state and even city. This seemingly modest feature carries incredible weight, proving to be a true game-changer for websites, whether they operate on a local or global scale.

No more guesswork required. With this new addition, the veil of uncertainty is lifted, allowing you to pinpoint the exact origins of your traffic. Say farewell to the unknown and embrace the impressive might of precision at your fingertips!

Heatmap Improvements

At Clarity, our commitment extends beyond just introducing new features; we’re equally devoted to enhancing our core offerings. Among these, Heatmaps stand as a cornerstone in the realm of behavioral analytics. We hold ourselves to the highest standards, consistently striving to elevate the user experience to new heights.

Now, let’s delve into the exciting transformations brought about this month, all driven by the invaluable feedback and requests from our valued customers:

Left Panel Collapse

Introducing “Left Panel Collapse” your gateway to a clutter-free, full-screen heatmap view. Dive deeper into the analytics that matter most, with ease and precision.

Hide Rankings in Heatmaps

Frustrated by obstructions? Say goodbye to blocked views in Microsoft Clarity’s heatmaps. Now, effortlessly hide rankings for a clear, unobstructed view. Plus, a simple hover of the mouse reveals rankings and data—pretty nifty, right?

Scroll Maps Sidebar Update:

Cut to the chase with clickable percentages on our scroll maps sidebar. Now, you can swiftly jump to any section on your page, pinpointing where users drop off, and streamlining your focus effortlessly.

Mobile SDK

Did you know Clarity supported mobile apps? Well, we do and it’s pretty amazing, but we might be a little biased. If you want to learn more about android mobile SDK click here.

Now, let’s unveil the key highlights of the latest version 1.3.3:

Feature 1: Embracing fragments within Android Activities and capturing React Native screen names. A fragment is a modular and reusable component of an activity that has its own layout, behavior and lifecycle. You can create a fragment once and use it in multiple activities or scenarios, without repeating the same code or layout. 

Feature 2: Empowering you to add custom tags to sessions during Clarity initialization. This was previously only available on website, but is now available for mobile as well.

Feature 3: Introducing device memory and cores as universal filters, allowing you to sift out low-end devices. Gain insight into the performance of these devices and discover potential customer journeys. Often application owners are interested to see the customer journeys across different types and models of end-user devices. This enables them to validate that their apps are working seamlessly on all varieties of devices and target specific enhancements for device categories that might face problems.

Enhancement 1: We’ve refined Clarity’s memory usage to ensure minimal impact on your app’s performance. Clarity now intuitively pauses data collection when your device resources are occupied, resuming seamlessly when they’re freed up by the operating system.

Enhancement 2: Size matters, and we’ve got it just right. We’ve trimmed down the SDK size by a whopping 60%, occupying a mere 300-500 KB. With Clarity, you save not just space but also money.

With Clarity, we’re not just keeping up with the times; we’re setting the pace. Explore the future of behavioral analytics for apps with us!

Final Thoughts

Certainly, here’s a more formal version:

If you’ve gained new insights about Clarity today, then this recap has hit the mark! If you were already well-versed in all these releases and improvements, you’re undoubtedly a Clarity aficionado. Keep your eyes peeled for next month’s recap because we’ve got some exciting developments in the pipeline! Stay tuned for more Clarity updates and enhancements.

Maximizing Digital Experience: Microsoft Clarity & Kameleoon Integration

Maximizing Digital Experience: Microsoft Clarity & Kameleoon Integration

When you think of a successful business it usually is connected with happy customers. Whether you’re running an e-commerce platform, a content-rich website, or a cutting-edge app, providing exceptional digital experiences is paramount to success. Understanding user behavior and optimizing your offerings accordingly is the key to achieving this. Microsoft Clarity and Kameleoon, two powerful tools that, when integrated, unlock a new realm of possibilities for enhancing your digital experiences.

Microsoft Clarity: A Deeper Insight

Microsoft Clarity is a powerful user behavior analysis tool that provides you with a comprehensive view of how users interact with your website. Through features like session recordings, heatmaps, and dashboard insights, Clarity equips you with the data needed to gain insights into user engagement, pinpoint pain points, and make informed, data-driven decisions to enhance your website’s usability.

Kameleoon: The All-in-One Optimization Platform

On the other side of the spectrum, Kameleoon stands as the all-in-one optimization solution. It boasts a unified platform that combines Web Experimentation, Feature Experimentation, and AI-Driven Personalization capabilities, all designed to cater to the needs of product managers, marketers, and developers. Let’s explore the Kameleoon platform in detail:

Web Experimentation

With Kameleoon’s Web Experimentation tools, you can create A/B tests and multivariate experiments to optimize various aspects of your website, such as page layout, content, and user flows. It allows you to test different variations and determine which ones resonate best with your audience.

Feature Experimentation

Kameleoon also enables Feature Experimentation, a crucial tool for product managers and developers. This solution allows you to test new features or changes to existing ones in a controlled environment before rolling them out to your entire user base, minimizing the risk of introducing issues or disruptions.

AI-Driven Personalization

Personalization is key to delivering exceptional digital experiences. Kameleoon’s AI-driven personalization capabilities empower you to create dynamic content and tailored experiences for each user. By analyzing user behavior and preferences, the platform can deliver content recommendations and product suggestions that increase engagement and conversions.

The Power of Integration: Microsoft Clarity and Kameleoon

Now, here’s where the real magic happens – the integration of Microsoft Clarity and Kameleoon. This integration takes your digital optimization efforts to new heights by combining user behavior analysis with experimentation, personalization, and a range of integration options. Let’s explore the specific benefits:

Sharper Customer Behavior Analysis with Clarity Integration

Kameleoon automatically enhances your Clarity data by adding tags to heatmaps and session recordings. This seemingly small addition is a game-changer, allowing you to analyze user behavior with precision. These tags enable you to segment your analysis based on each experiment variation, offering deeper insights into how different user groups interact with your website.

Key Benefits of the Integration:

  • Analyze Behavior During Experiments: With Kameleoon’s tags on Clarity data, you can now analyze how your visitors behave while exposed to specific experiments. This means you can pinpoint exactly how different experiment variations impact user behavior by watching session replays on Clarity.
  • Optimization Insights: Clarity heatmaps offer invaluable insights into where users are clicking, scrolling, and engaging on your website. By integrating this data with Kameleoon, you can identify areas for optimization more effectively. This information helps you prioritize your roadmap of experiments in Kameleoon, ensuring that you focus on the most critical elements that impact user engagement and conversion rates.

In conclusion, the Microsoft Clarity and Kameleoon integration isn’t just about combining two powerful tools; it’s about truly understanding and improving your digital experiences. With enhanced segmentation and the ability to analyze user behavior during experiments, you can make more informed decisions, drive optimization efforts with precision, and ultimately deliver digital experiences that resonate with your audience and lead to tangible business growth. This integration truly empowers you to take your optimization game to the next level.

Don’t miss out on the opportunity to maximize your digital experiences. Explore the integration of Microsoft Clarity and Kameleoon today and set your journey toward user-centric excellence. Your audience will thank you, and your bottom line will reflect the results. It’s time to elevate your digital game!