Bots vs. Real Users: Who is really visiting your site?

Bots vs. Real Users: Who is really visiting your site?

Your site visitor may not be who you think they are. Did you know that for some sites, bots – automated visits – can be up to 50% of a website’s total traffic? With the new advancements in automation and artificial intelligence, bot traffic is becoming even more omnipresent.  

In this blog post, we’ll dive into what bot traffic is and how you can make sure you know what real users, not bots, are doing on your site.  

What is bot traffic?  

Bot traffic refers to automated visits to a website. Bots come from various sources such as search engines, social media platforms, and other individuals or websites. For example, search engines use bots to crawl and index websites for search ranking. Some bots may be beneficial to your website, while others can be malicious and cause harm by slowing down your site’s performance. 

How does bot traffic affect my website analytics data? 

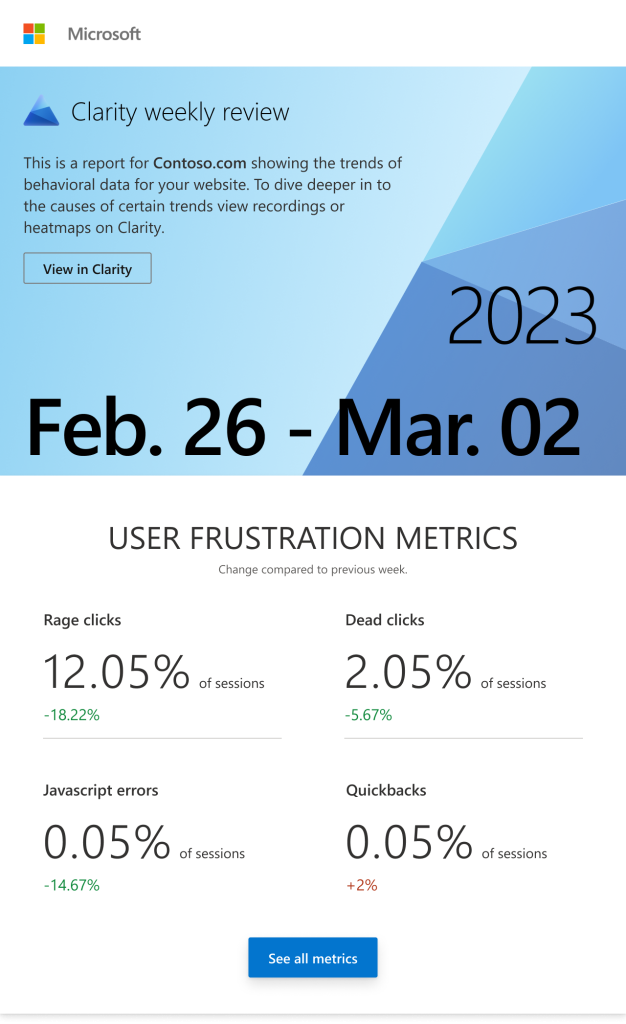
When bots visit your site, they generate fake automated sessions that can skew your metrics like page views, bounce rate, time on site and conversion rates. For example, if a bot visits your site and generates hundreds of page views in just a few seconds, it could artificially lower your average time on site or increase pages per session.   

Bots can lead to misleading conclusions about your user experience—like the bot example above that might make you think your time on site has gone down.  As a result, these bot sessions can lead you astray, by hiding the impact of changes you make or by leading you to invest in features that don’t matter to your real users and business goals.  

What can I do about bots?

To optimize your website effectively, focus on your real users: Make sure that you detect bot traffic and filter it out from your analytics tools.  

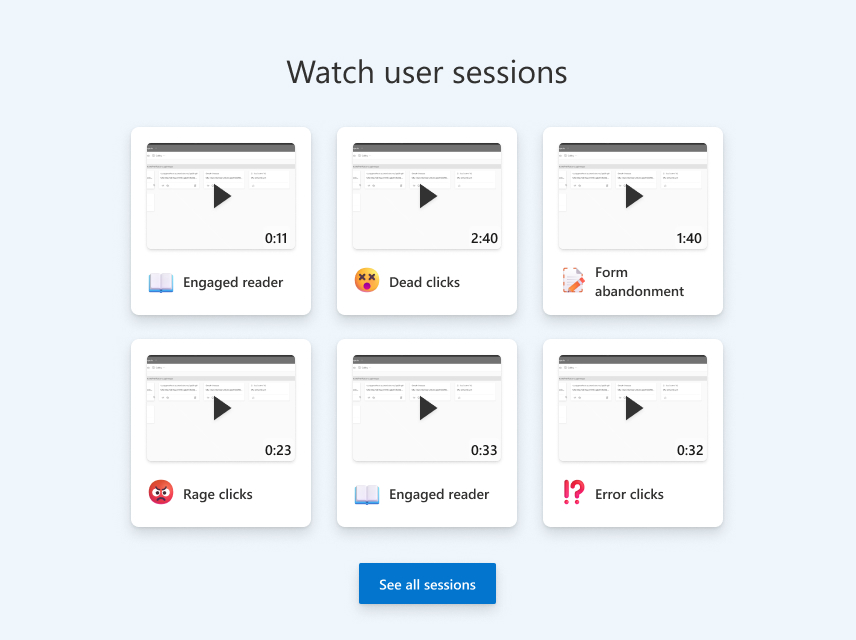
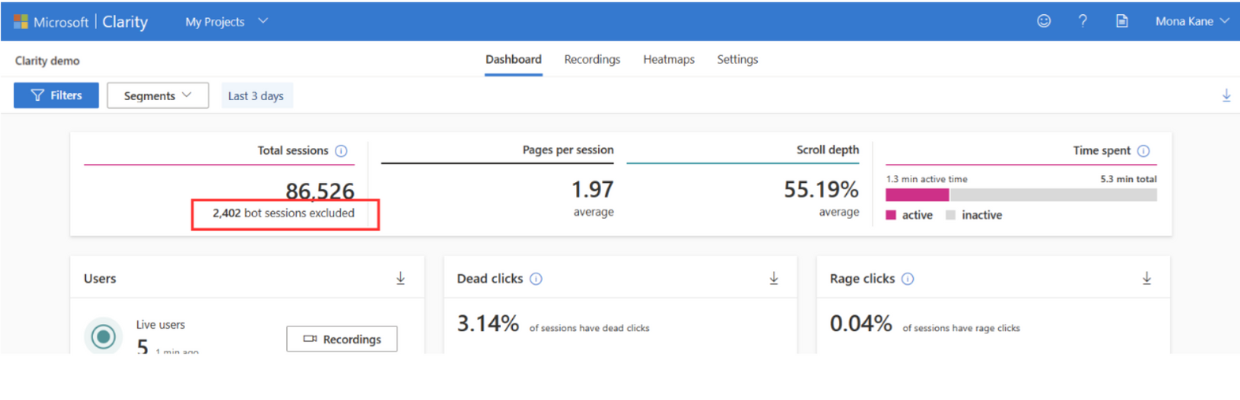
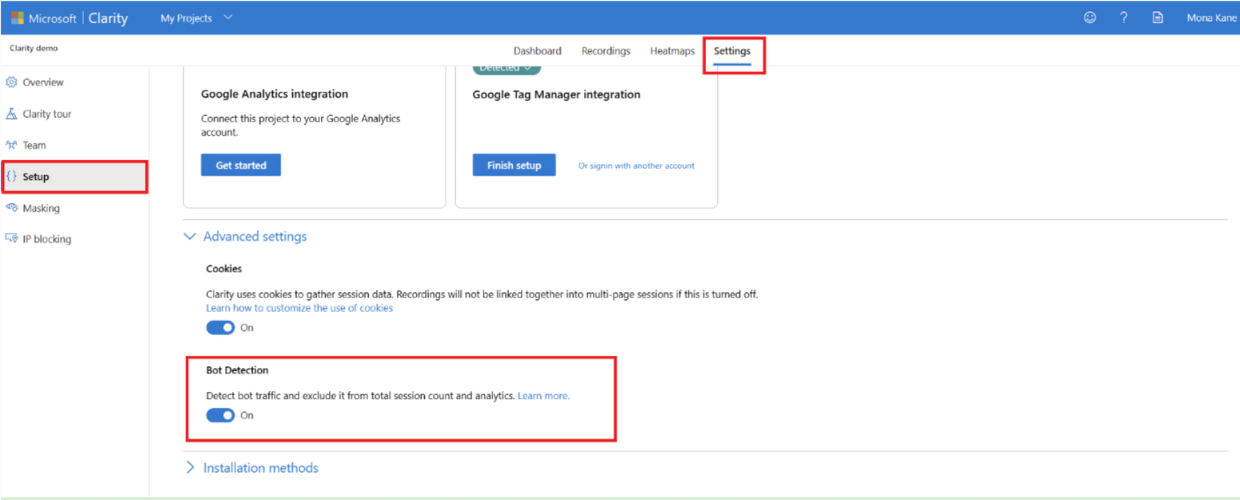
When Clarity’s bot detection is turned on, the dashboard displays the count of bot sessions. Clarity also filters out bot traffic from your dashboard, heatmaps, and session recording. That way you can see exactly how real users are interacting with your site. This enables you to identify areas for improvement that will genuinely benefit users, such as slow-loading pages or confusing navigation. 

While Clarity’s bot detection is on by default, you have complete control over how bot traffic is handled in your analytics data: you can also turn bot detection off or back on again. When bot detection is turned off, Clarity can neither detect bot traffic nor exclude it from your data. This may be useful if you want a more comprehensive view of all sessions on your site, including both human and bot traffic. However, it’s important to keep in mind that this may result in distorted analytics data, due to the inclusion of bot behavior. 

Sum it up for me! 

Detecting bot traffic is crucial for optimizing a website because it affects the accuracy of your analytics data. By using Clarity’s bot features, site owners can filter out bot traffic to get an accurate picture of how real users are interacting with their sites. Whether you’re just starting out with website optimization or looking to take your efforts to the next level, Clarity’s bot features are a valuable tool in your arsenal. So why wait? Start using Clarity today and start optimizing your website for real users! 

Get Your Weekly Update: Introducing Clarity Weekly Digest

Get Your Weekly Update: Introducing Clarity Weekly Digest

In today’s fast-paced world, it can be difficult to keep track of all the projects you’re working on. That’s why we’ve created a feature that sends out weekly emails with a summary of your project progress.

Clarity weekly digest which provides a summary of key metrics about user sessions on your website. The emails include frustration metrics such as rage clicks, dead clicks, JS errors, and quick backs. These metrics can help you understand where users are encountering problems and what may be causing them to leave your site prematurely. 

In addition, the email also provides sample sessions for the week so you can see exactly how users are interacting with your site and identify any pain points they may be experiencing. Understanding this information will allow you to optimize your website by making changes that align with the needs of your audience, resulting in a better user experience for everyone involved. 

 Clarity Digest Module

Finally, our weekly email digest also provides high-level metrics like total sessions, average pages per session and average scroll depth. These metrics give you an overview of how well your website is performing overall and can help you identify areas that need improvement. For example, if the average pages per session are low, it may be time to make changes to keep users engaged and, on your site, longer. 

Joining our Weekly Email Digest is effortless 

To join, log into your Clarity account and head to the “Manage Account” option located on the upper right corner of your screen. A list of account settings will then be displayed, including a “Subscribe” button towards the bottom that you just need to click on to start receiving our insightful reports each week. Don’t worry, if at any point you want to unsubscribe, simply follow these same steps.

Give it a try, and if you use the Clarity weekly email report regularly, email us your story at claritycasestudies@microsoft.com. We’d love to discuss featuring you in an upcoming customer case study!

Android Mobile SDK

Android Mobile SDK

With a majority of mobile usage being through apps, it’s crucial to ensure a high-quality in-app experience because it can significantly impact user retention. That makes the use of analytics to optimize app experiences to achieve maximum engagement and customer satisfaction extremely important.

It’s no wonder that mobile apps have taken the world by storm and that they shifted how the internet works.  In fact, 43% of all internet e-commerce traffic comes from apps.  We at Microsoft always put our customers first and we always go where our customers are.

That’s why we are announcing the availability of the beta version of Microsoft Clarity for Android Apps!  Now you can unlock user behavior insights for your Android mobile apps all with the simple experience you are used to with Clarity Web and for the same price, Free!

All you have to do is signup for clarity (if you don’t already have an account), create a mobile project, and then follow the installation steps!

What you’ll find in Clarity for mobile apps

Dashboard & Insights: 

You will be able to see an at-a-glance overview of the behavior of your users.  User friction indicators like rage and dead taps will give you a strong insight into which parts of your app require your attention.  This will also help you uncover bugs and issues lurking within your UI.  Finally, you can segment and filter users on different dimensions including phone model, operating system, and much more! 

Recordings: 

Session replay is a reconstructed experience of how your users experience your app.  It shows events like taps, movements, and scrolls.  This happens in the form of a reconstructed walkthrough-style video.  Session Recordings help you understand your users’ experiences like never before. 

Heatmaps: 

Gain insights across potentially thousands of sessions on the general usage trends within your app screens.  Tap heatmaps is an aggregation of taps and user interactions across all user sessions. This shows you how the majority of users interact with your app.  This will help you dig deeper into pivotal aspects of your experience and understand where the action is! 

Built around user needs 

A question that we commonly got from our group of early users is that  “Will the Clarity mobile SDK still support my app even if it has webviews?” The answer is “Yes”.  Clarity mobile SDK provides an integrated experience across native and web components within your app, so you can experience everything seamlessly on the same canvas.  It also provides a high level of granularity and flexibility to control masking elements across webviews and the native components.  

And also we often got this question: “Will Clarity Mobile SDK slow down my app“?  We know that for app developers, performance is top of mind.  The Microsoft Clarity SDK has been designed to minimize the impact on mobile performance with its unique screen re-drawing approach.  Our SDK captures low-level drawing operations instead of videos/screenshots lending itself to a highly optimized experience.  

It’s just the beginning….. 

This release is the first step in a long journey to bring all that you love about Clarity to mobile apps!  For now, our SDK supports native Android, React Native, and Cordova.  We will keep adding features and continuously adapting our capabilities to support popular frameworks and technologies.  

How to get started 

Sounds exciting?  Here’s how to test Clarity’s Mobile SDK, Just Sign up for our waitlist

Tell Us How it worked for you! 

We are super excited about our Clarity Mobile SDK.  We will continue launching new features that will provide value to our users at the existing price of, Free.  

Give it a try, and email us your suggestions/ Inquiries at clarity-apps@microsoft.com.  We’d love to hear your feedback as we continue to build the product around you!